Over the past five days, the somewhat volatile NIFTY oscillated in a defined range before ending the week with modest gains. Throughout the week, the majority of the time was spent on a corrective note. It was only the last day of the trading week that saw massive short-covering and helped the benchmark index close in positive territory on a week-on-week basis. The markets traded in the 324-point range and, after testing crucial levels, kept their head above their important supports. Following a largely bearish undertone except for the last trading session, the NIFTY ended with a net gain of 185.95 points (+1.04%) on a weekly note.
We once have a truncated week, as Friday will be a trading holiday on the account of Gurunanak Jayanti. The NIFTY is clinging on to a rising trend line support on the weekly charts; on the daily chart, it is busy defending a head-and-shoulder pattern that can turn potentially bearish. However, to avoid weakness, NIFTY will have to move past 18130 as soon as it can; failing this, it may invite some weakness again and stay under a broad consolidation. The surge that we saw on Friday was due to heavy short-covering; this was evident as the up move came with a decline of over 6.80 lakh shares or 6.32% in Net Open Interest in NIFTY futures.
The only thing that the NIFTY needs to take care of in the coming week is to move past and then stay above 18130 levels. The levels of 18145 and 18365 will act as resistance points. The supports come in at 18010 and 17800 levels.
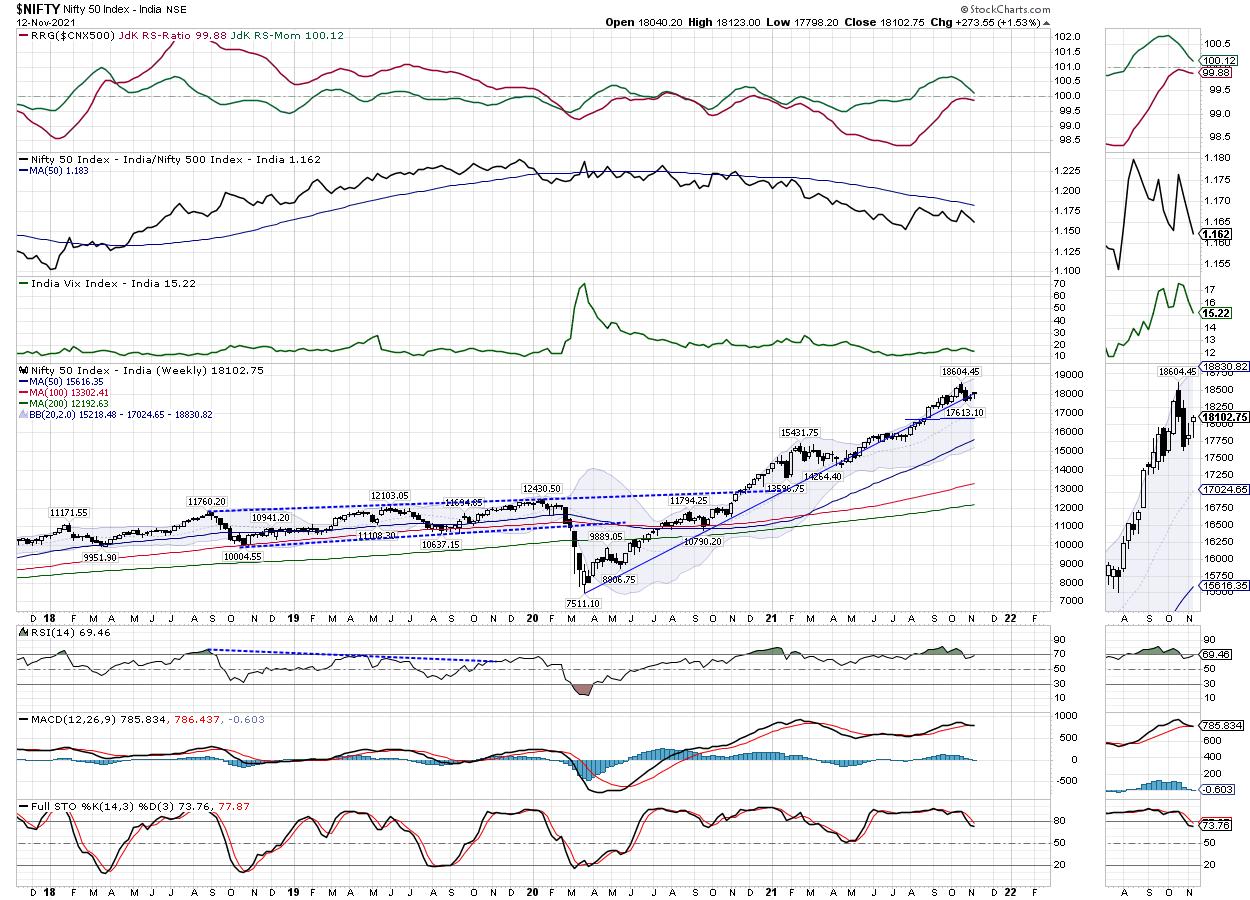
The weekly RSI is 69.41; it is neutral and does not show any divergence against the price. The weekly MACD is bullish and above its signal line. However, the narrowing slope of the histogram shows the possibility of this indicator showing a negative crossover in the coming weeks.
A candle with a small real body and a somewhat longer lower shadow occurred. No major formations were noticed on the candles.
The pattern analysis shows that the NIFTY has managed to stay above the upper rising trend line. This trend line begins from the low point formed in March 2020 and joins the subsequent higher bottoms. It would be crucial for the NIFTY to stay above this rising trend line pattern support.
All in all, the markets are hanging on precariously to their supports; the supports are not violated, on the one hand, but, on the other hand, a clear trend on the upside has also not resumed. In the present technical setup, it is recommended that you avoid any aggressively leveraged exposures on either side. Unless a directional bias is established, the risk-reward ratio will stay adversely skewed regardless of the kind of exposures taken. It is also recommended that you continue staying highly stock-specific and selective in approach towards the markets.
Sector Analysis for the Coming Week
In our look at Relative Rotation Graphs®, we compared various sectors against CNX500 (NIFTY 500 Index), which represents over 95% of the free float market cap of all the stocks listed.
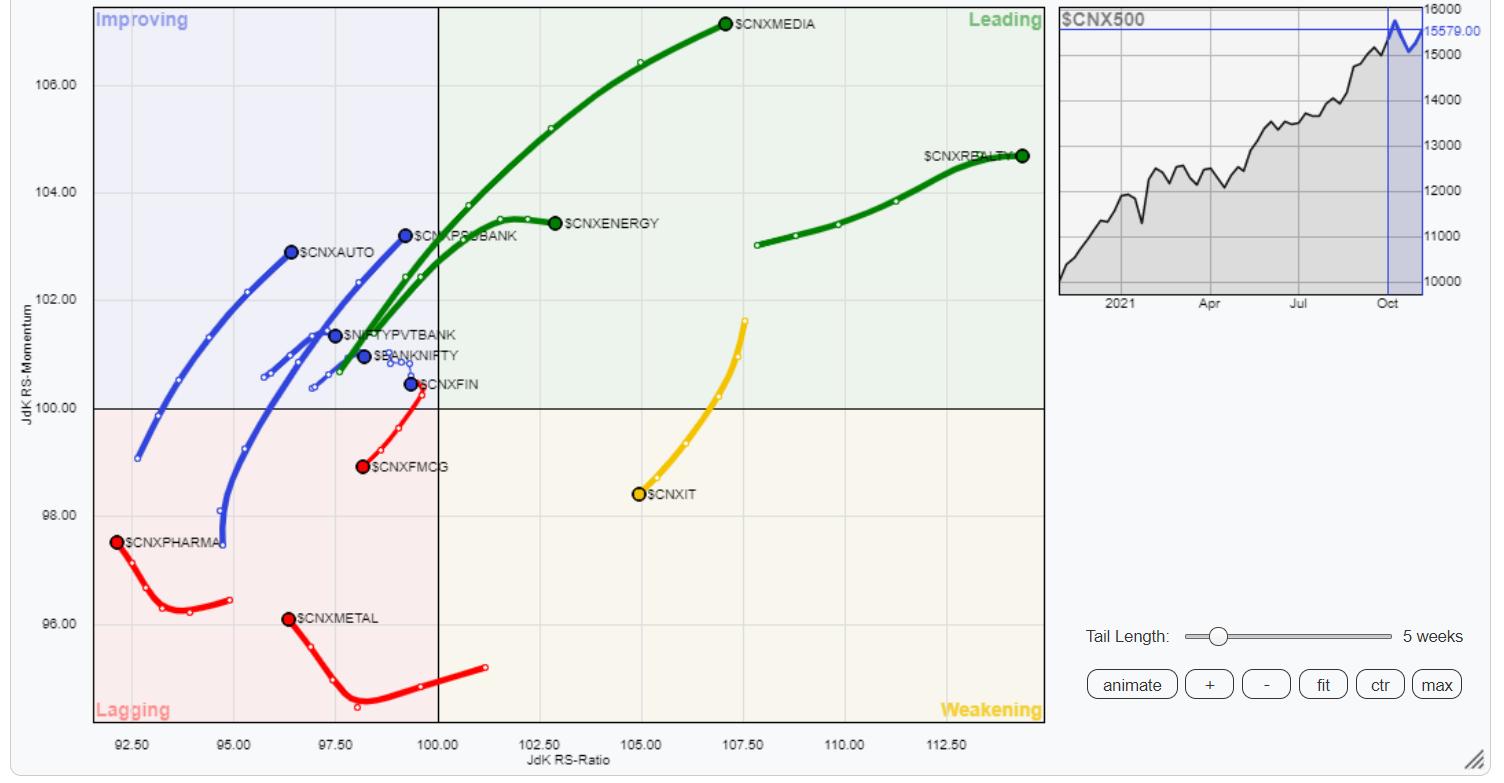
The analysis of Relative Rotation Graphs (RRG) does not show any major structural change in the setup; it has just seen rotations advancing further from their respective places over the previous week. The Energy, Media, Realty, PSE, Infrastructure, and Midcap Indexes are inside the leading quadrant of the RRG. These groups are likely to relatively outperform the broader markets. The Consumption Index is also inside the leading quadrant; however, it is seen giving up its relative momentum at present.
The NIFTY IT Index stays inside the weakening quadrant. NIFTY Pharma, Metals and the Commodities indexes are inside the lagging quadrant. All of these three are showing improvement in their relative momentum against the broader markets. The FMCG index is also inside the lagging quadrant; it is languishing while paring its relative momentum against the broader markets.
NIFTY PSUBank, BankNifty and Nifty Auto are inside the improving quadrant and appear to be firmly building on their relative momentum. The Financial Services index is also in the improving quadrant, but it is seen rotating southward while giving up on its momentum.
Important Note: RRG™ charts show the relative strength and momentum for a group of stocks. In the above Chart, they show relative performance against NIFTY500 Index (Broader Markets) and should not be used directly as buy or sell signals.
Milan Vaishnav, CMT, MSTA
Consulting Technical Analyst
www.EquityResearch.asia | www.ChartWizard.ae
- For Premium Equity Portfolio Advisory on Indian Stocks, Click Here.
- Alpha-generating actionable investment ideas on the US and UK Equities, Click Here.
- For International Commodities like Gold, Crude Oil and EURUSD/GBPUSD pairs, Click Here.


