Bollinger Bands are the volatility bands placed above and below the Moving Average. Being based on volatility, the bands widen and narrow, i.e. they adjust themselves dynamically as the prices move. When the prices are volatile, the Bands widen with the increase in volatility; they contract in times of low volatility.
Bollinger Bands tend to squeeze (get narrow and contract) as the volatility falls. According to John Bollinger, periods of low volatility are often followed by periods of low volatility. Any breakout or a breakdown from a Bollinger band squeeze often results in a major trending move.
Important: Bollinger Band Squeeze is essentially a neutral formation. It should never be traded in isolation and no directional move should be anticipated. One must always wait for price confirmation; that is, wait for the price to penetrate the resistance or violate support before taking any directional call in the stock.
The following three stocks are presently under Bollinger Band Squeeze; the other pieces of technical evidence present on the chart show a likely potential up move in price subject to their moving past the immediate resistance level.
CROMPTON.IN
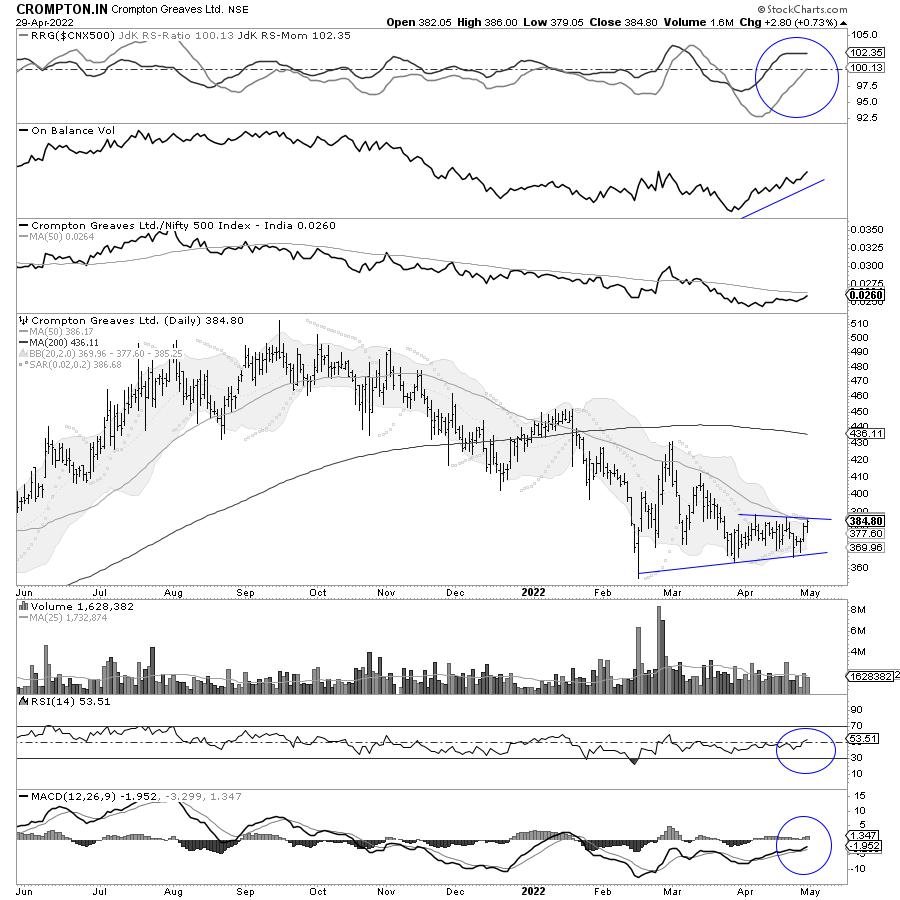
CROMPTON is showing signs of a potential reversal; any move above 390 will mark a potential trend reversal for the stock. The MACD is in continuing buy mode; the RSI shows a strong bullish divergence against the price. While the RSI has broken out to a new high from a pattern, the price has not done so. This has resulted in the bullish divergence of RSI against the price.
While the stock remains in the leading quadrant when benchmarked against the broader NIFTY500 index, the RS line against the broader markets has flattened and has started to rise. The OBV is rising.
If the upward breakout happens above 390, the stock has the potential to test the 430 level. Any move below 362 will nullify this view.
DIVISLAB.IN
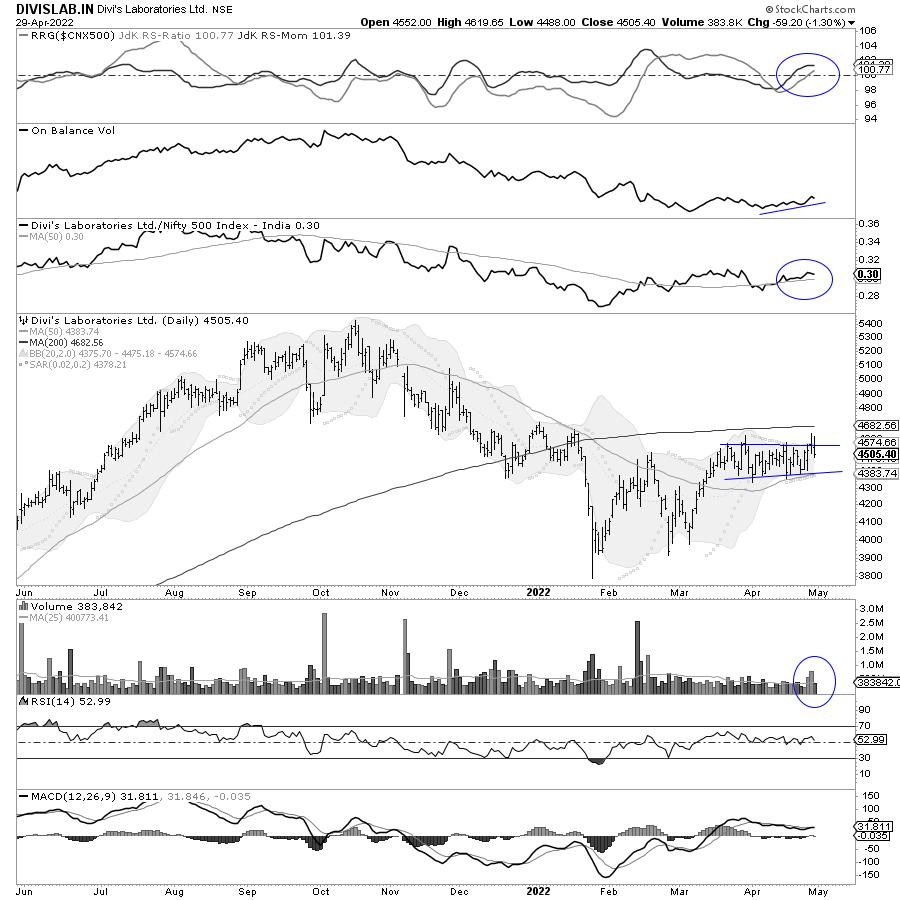
DIVISLAB is presently in a sideways price movement as the stock remains in a trading zone of 4350-4550. It has tried to break above the crucial resistance level of 4550 with higher-than-average volumes. However, a throwback has taken the stock back inside the trading range.
A breakout will occur when the prices thrust above 4575 and sustain above that point. If that happens, then the stock may see a breakout from a Bollinger band squeeze. The stock is presently in the leading quadrant of the RRG when benchmarked against the broader NIFTY500 Index. The RS line against the broader markets is rising and is above the 50-DMA.
If the breakout occurs above the 4575 level, the stock has the potential to test 4965-5000. Any move below 4300 will nullify this view.
SUNPHARMA.IN
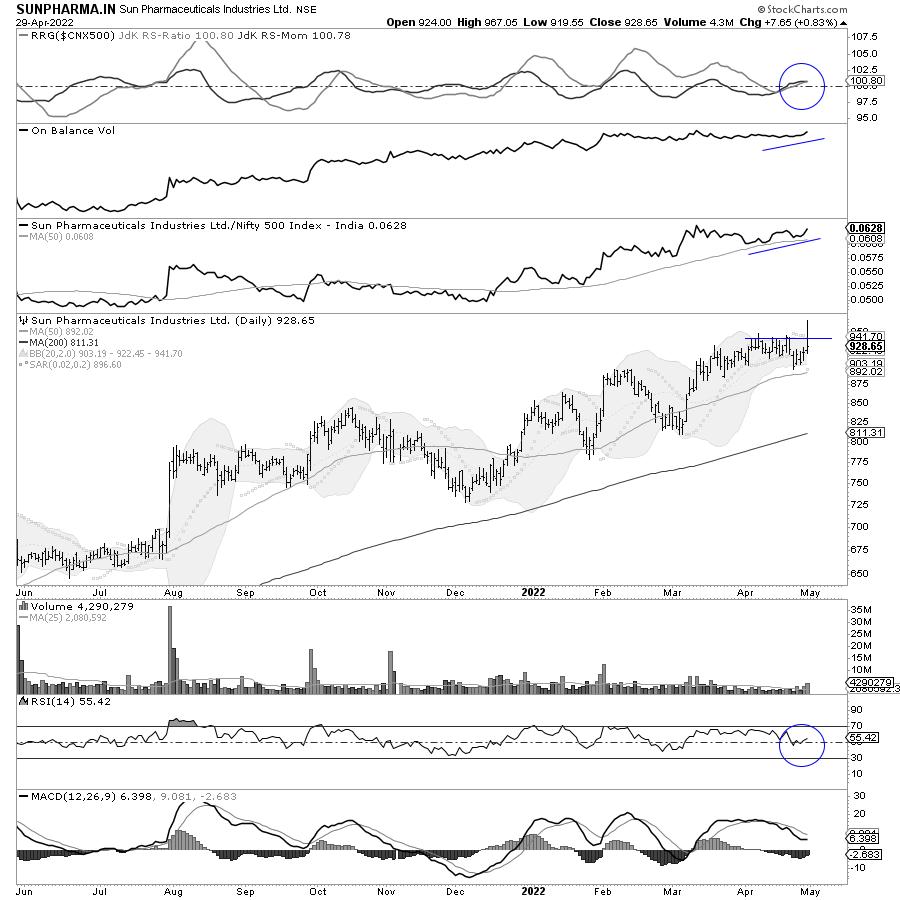
SUNPHARMA is one of the better performers in the Pharma group; the stock remains in a secular uptrend. Presently, after resisting the 941 level multiple times, the stock is presently in a narrow congestion zone. The volatility has substantially contracted due to low volatility in the stock.
A strong volume-supported move above 945 will result in a breakout from this Bollinger band squeeze. The RSI is neutral and does not show any divergence against the price. The RS line against the broader NIFTY500 index is in a firm uptrend and rules above its 50-DMA.
While the stock has rolled inside the leading quadrant of the RRG when benchmarked against NIFTY 500 index, the On-Balance-Volume (OBV) has already marked a new high ahead of the actual price breakout.
If the breakout occurs on the expected lines, the stock may test the 985-1025 levels. Any move below 900 will nullify this view.
Milan Vaishnav, CMT, MSTA
Consulting Technical Analyst
www.EquityResearch.asia | www.ChartWizard.ae
Disclosure pursuant to Clause 19 of SEBI (Research Analysts) Regulations 2014: Analyst, Family Members, or his Associates holds no financial interest below 1% or higher than 1% and has not received any compensation from the Companies discussed.
The securities discussed and opinions expressed in this report may not be suitable for all investors, who must make their own investment decisions, based on their own investment objectives, financial positions, and needs of specific recipients. This may not be taken in substitution for the exercise of independent judgment by any recipient.
The recipient should independently evaluate the investment risks. The value and return on investment may vary because of changes in interest rates, foreign exchange rates, or any other reason. Past performance is not necessarily a guide to future performance. The usage of the Research Reports and other Services are governed as per the Terms of Service on https://equityresearch.asia/terms-of-use
The Research Analyst has not managed or co-managed the issues of any of the companies discussed and has not received any such remuneration from such activities from the companies discussed.
The Research Analyst has not received any remuneration from the Merchant Banking activities.
The Research Analyst has adopted an independent approach without any conflict from anyone. The Research Analyst has not received any compensation or other benefits from the companies mentioned in the report or third party in connection with the preparation of the research report.
Compensation of the Research Analysts is not based on any specific merchant banking, investment banking or brokerage service transactions.
The Research Analyst is not engaged in a market-making activity for the companies mentioned in the report.
The Research Analyst submits that no material disciplinary action has been taken on him by any Regulatory Authority impacting Equity Research Analysis activities.
This report is not directed or intended for distribution to, or use by, any person or entity who is a citizen or resident of or located in any locality, state, country, or other jurisdiction, where such distribution, publication, availability, or use would be contrary to law, regulation or which would subject the Research Analyst to any registration or licensing requirement within such jurisdiction.


