While continuing to trade precisely on the expected lines, the NIFTY continued to struggle to keep its head above the key levels as it closed the week on a flat note with a negative bias. All the five days of the week stood very shaky for the markets; NIFTY either opened with a gap up or with a gap down on almost all the days. It failed to keep its head above the crucial 200-DMA on the daily chart; the Index also continued resisting the 20-Week MA. The NIFTY oscillated over 488-points over the past five days and ended with a net loss of 69.40 points (-0.40%) on a weekly note.
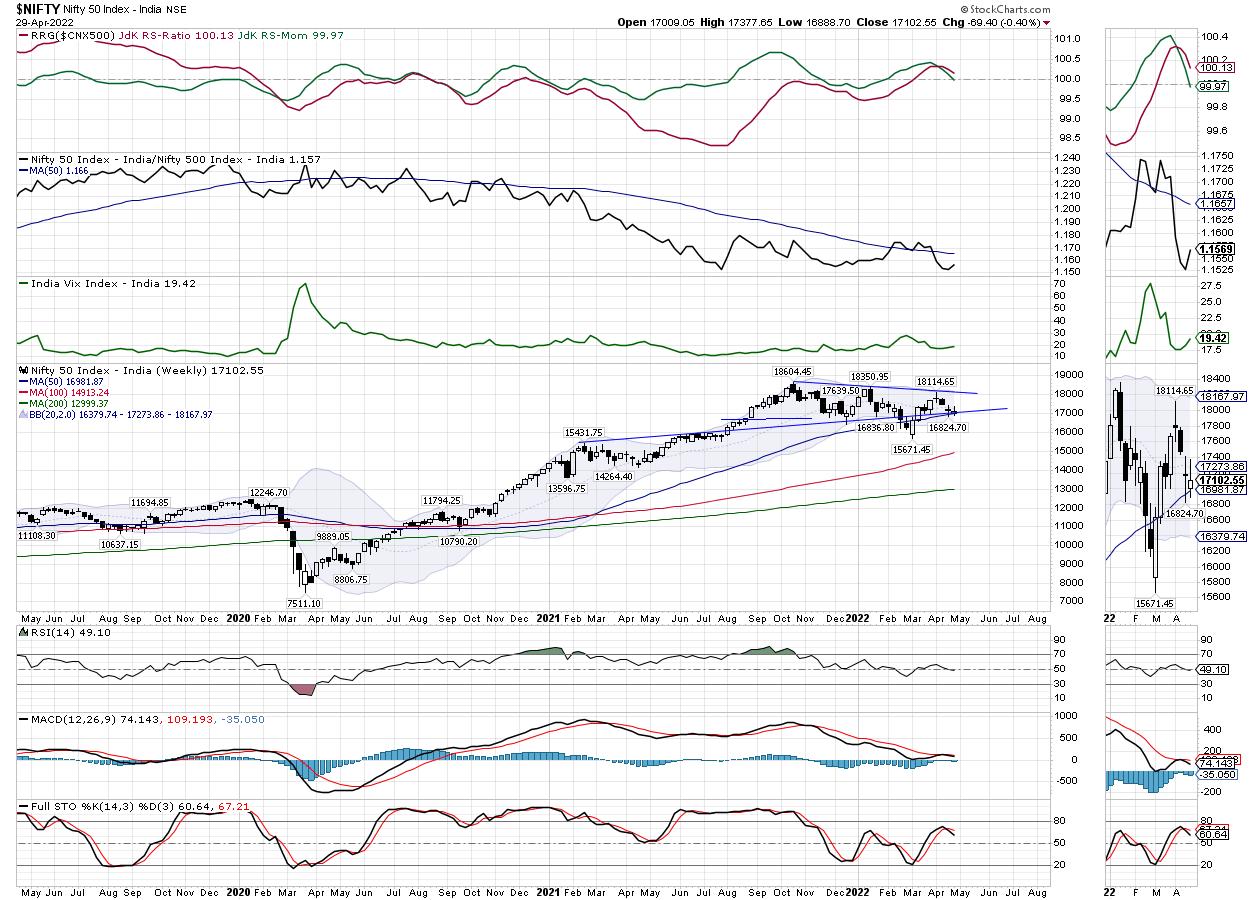
From a technical perspective, NIFTY is placed at a very crucial juncture. On one hand, it has failed to keep its head above the 200-DMA which stands at 17225. On the other side, it has continued to take support on a pattern support trend line and the 50-Week MA. The 50-Week MA stands at 16983. The pattern analysis of the chart as well as the derivatives data continue to show the zone of 16850-17500; this 150-point zone is a strong support area for the NIFTY. Besides this, the index has also seen the addition of fresh short positions on Friday as evident from the derivatives data.
In any case, the markets in general and NIFTY in particular remain in a no-trade zone. So long as the NIFTY is above 16850 and below 17500, it is totally unlikely that it will have any sustainable directional bias on either side. The coming week is likely to see the levels of 17280 and 17495 acting as probable resistance points. The supports come in at 16950 and 16800 levels. The trading range is likely to remain a bit wider than usual over the coming week.
The weekly RSI is 49.09; it stays neutral and does not show any divergence against the price. The weekly MACD is bearish and below the signal line. The occurrence of the spinning top on the candles continues to point towards the indecisive and tentative behavior of the market participants.
While the markets stayed largely flat on a week-on-week basis, volatility increased. INDIAVIX rose by 5.79% to 19.42 on a weekly basis. The global, as well as Indian markets, are also set to react to the FOMC decision slated to come in the middle of the coming week. Markets appear to have largely discounted the rate hike of 50 bps.
Regardless of any external factor that may affect the markets and the trend, it would be prudent to stick to the technically derived levels and avoid getting carried away by the gaps on either side. From a technical standpoint, the NIFTY has formed a congestion zone; all gaps occurring within this area pattern will have little or no significance unless there is a breakdown below 16850 or a breakout above 17500 levels.
All in all, the markets remain in the mentioned defined zone; from a weekly perspective, it would be crucial for the NIFTY to defend the levels of 50-DMA; this point is at 16983 at present and is expected to act as important support on a closing basis. Unless any sustainable directional trend is established, it is strongly recommended to avoid shorts. Any downsides must be used to make select purchases. At the same time, all profits must be vigilantly protected at higher levels so long as the NIFTY is below 17500. A selective and cautious approach to the markets is advised.
Sector Analysis for the coming week
In our look at Relative Rotation Graphs®, we compared various sectors against CNX500 (NIFTY 500 Index), which represents over 95% of the free float market cap of all the stocks listed.
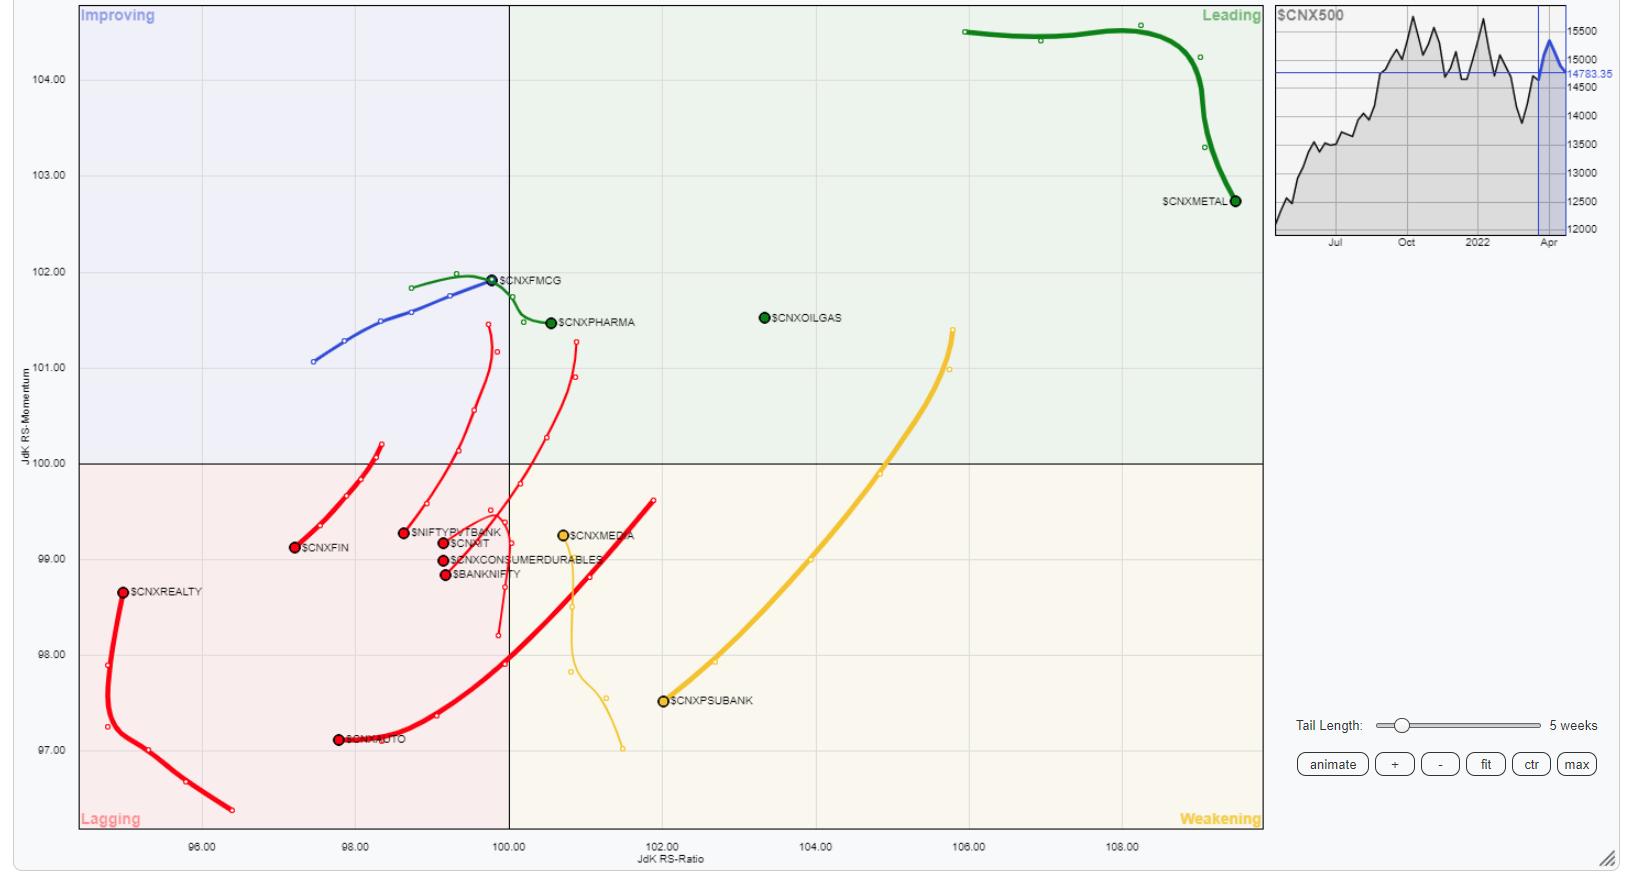
The analysis of Relative Rotation Graphs (RRG) shows that the broader markets are set to relatively outperform again as the NIFTY MIDCAP 100 index has rolled inside the improving quadrant.
The Energy, Commodities, Pharma, NIFTY PSE, Metal, and the Infrastructure indexes are inside the leading quadrant. These groups are set to continue relatively outperforming the broader markets. The NIFTY Media index is inside the weakening quadrant. But it is seen improving on its relative momentum On the other hand, the PSU Bank index is also inside the weakening quadrant but it is seen paring its relative momentum which may negatively affect its relative performance.
NIFTY Bank, Services Sector Index, IT, Auto, and the Financial Services index languish inside the weakening quadrant. These groups may relatively underperform the benchmark. On the other hand, the NIFTY Realty index is also inside the weakening quadrant, but it is seen strongly improving on its relative momentum against the broader NIFTY 500 index.
Besides NIFTY Midcap 100 Index, the Consumption and FMCG indexes are also inside the improving quadrant. They are likely to perform better against the broader markets while maintaining their relative momentum.
Important Note: RRG™ charts show the relative strength and momentum for a group of stocks. In the above Chart, they show relative performance against NIFTY500 Index (Broader Markets) and should not be used directly as buy or sell signals.
Milan Vaishnav, CMT, MSTA
Consulting Technical Analyst
www.EquityResearch.asia | www.ChartWizard.ae


