The bulk of the past five sessions was spent on a corrective note by the Indian equity markets. There were bounces that did not sustain as the NIFTY struggled to keep its head above the 200-DMA level. The previous week saw a wide trading range of 590 points. In the previous weekly note, it was also mentioned that, for any sustainable up move to happen, moving past and keeping the head above the 17500 would be crucial. The NIFTY failed to move past this level. While trading in line with the overall weak global trade setup, the NIFTY declined through the week and ended with a net loss of 303.70 points (-1.74%) on a weekly basis.
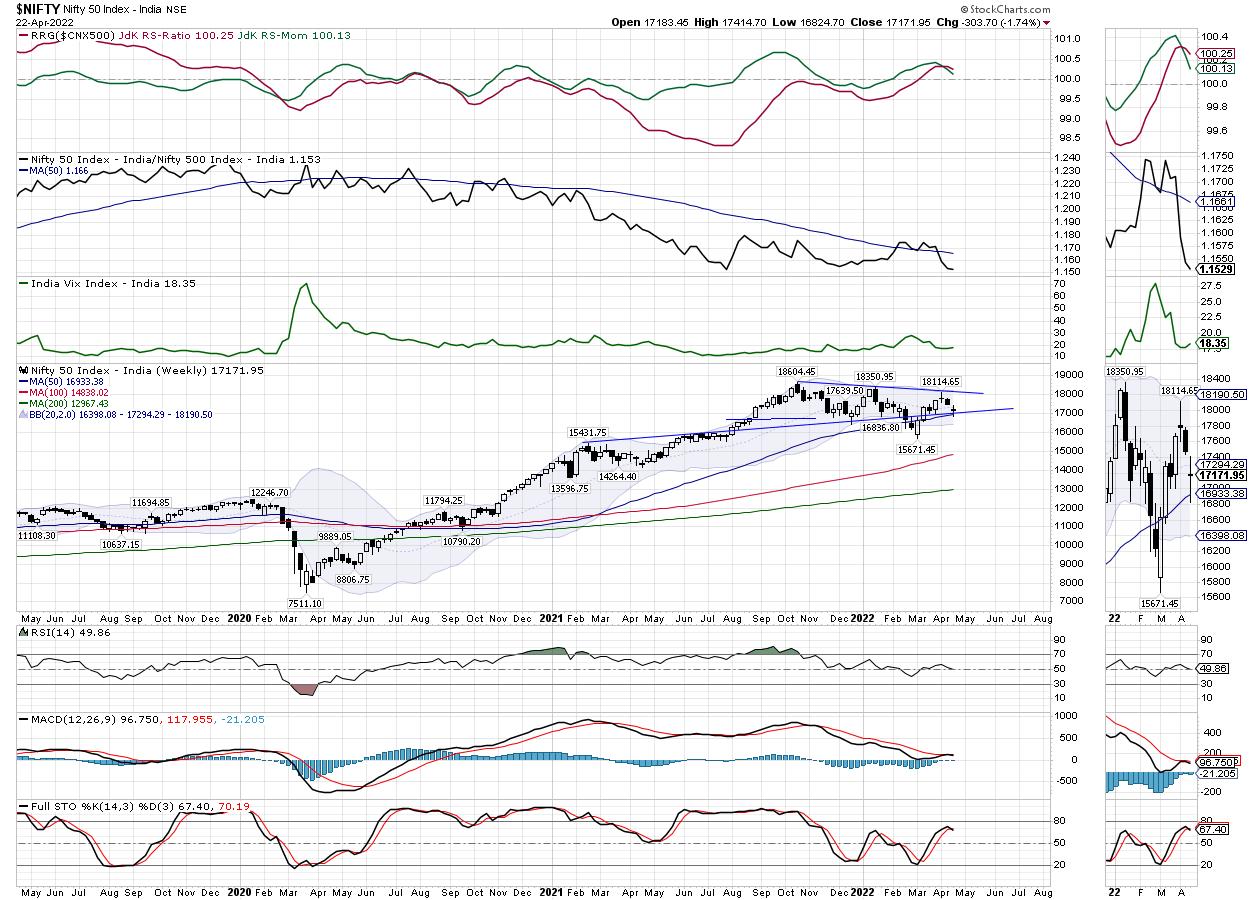
The coming week is also an expiry week; we will have monthly derivative expiry, which is bound to influence the trade. However, the level of 17500 continues to hold the highest Call OI accumulation. For any sustainable up move to happen, moving past this point will be particularly important. Having said this, the NIFTY has mildly violated a trend line support on the NIFTY. It has taken support on the 50-Week MA which stands at 16935; this level remains crucial support on a closing basis for the NIFTY in the near term. It has also violated the 200-DMA again on the daily charts; 200-DMA stands at 17193. Over the coming weeks, NIFTY's price behavior against the 17000 levels will be crucial to watch.
Volatility increased a bit; INDIAVIX rose by 3.19% to 18.35. The coming week is likely to remain rangebound. The upsides, if any, are likely to stay capped at 17500 levels. On the lower side, violating 17000 would mean some incremental weakness for the markets. The levels of 17350 and 17535 will act as immediate resistance points for NIFTY; supports are likely to come in at 17000 and 16880 levels.
The weekly RSI is 49.85; it remains neutral and does not show any divergence against the price. The weekly MACD has turned bearish again following a negative crossover; it now trades below the signal line.
The pattern analysis shows that the NIFTY has mildly violated the extended trend line support level briefly; however, it has managed to close above it. This trend line begins from the 15400 level, joins the subsequent high point and extends itself. The NIFTY has also defended the 50-Week MA as of now, which remains an important support level to watch over the coming weeks.
All in all, there is little chance of the market seeing any runaway up move in the coming week. In the event of any technical pullback, the upside moves may get capped near 17500 levels. On the lower side, defending the 50-Week MA on a closing basis will be very important for the market. The safe and prudent way to navigate such a technically tricky market would be to be highly stock-specific in the approach. It would be wise to stick to low beta stocks; also, focusing on defensive pockets like FMCG, Pharma, Consumption, etc. would pay off as well. A cautious approach is advised for the coming week.
Sector Analysis for the Coming Week
In our look at Relative Rotation Graphs®, we compared various sectors against CNX500 (NIFTY 500 Index), which represents over 95% of the free float market cap of all the stocks listed.
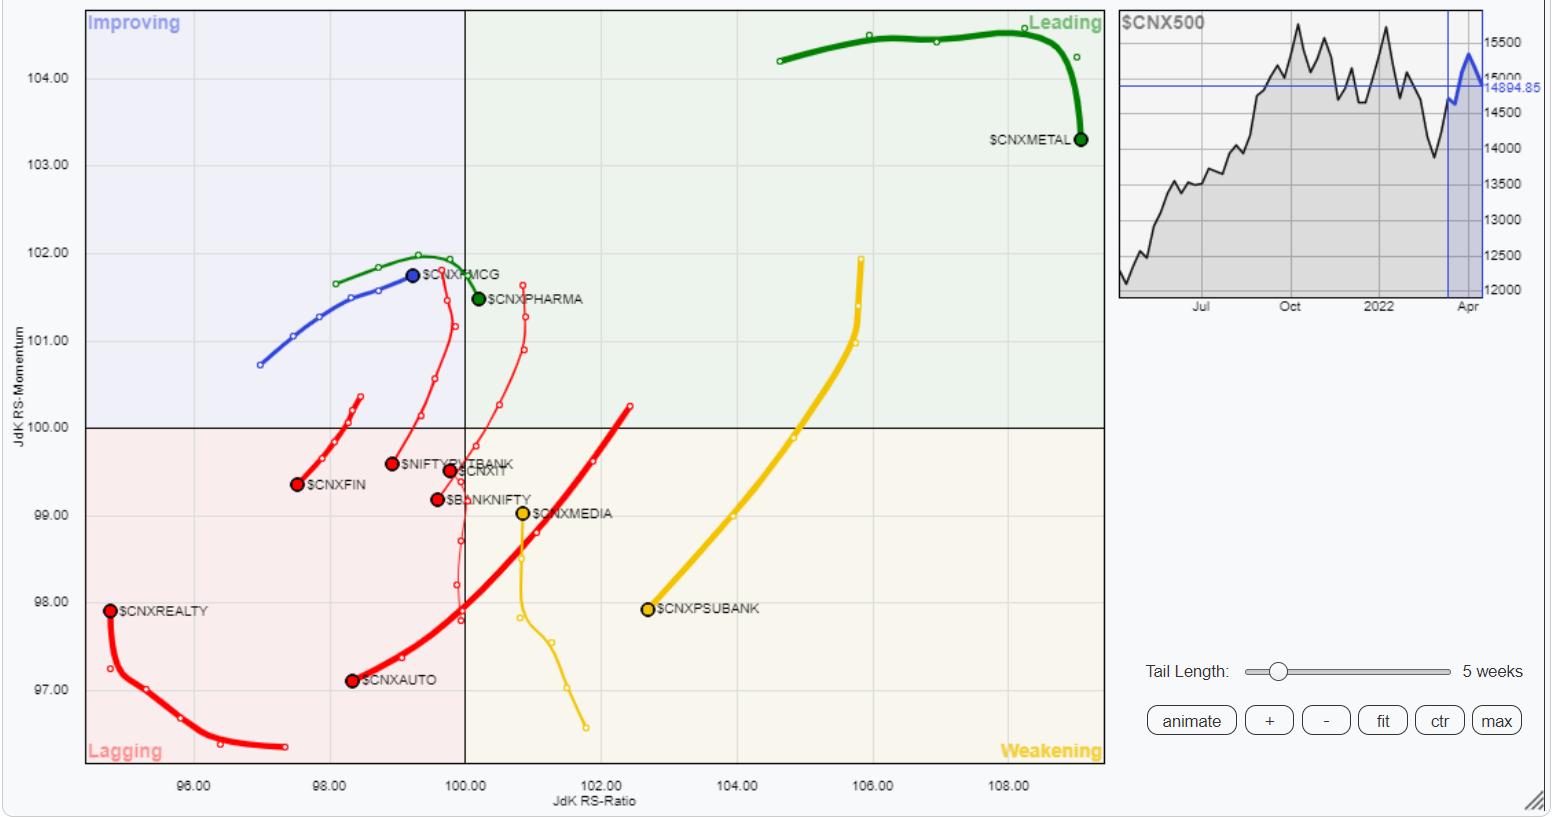
The analysis of Relative Rotation Graphs (RRG) shows that the Commodities, Energy, Pharma and PSE indices are placed inside the leading quadrant and may relatively outperform the broader markets. The Commodities and Metal indices are also inside the leading quadrant, but are seen giving up on their relative momentum. NIFTY Infrastructure index has rolled back inside the leading quadrant as well.
The PSU Bank group continues to languish inside the weakening quadrant. Media, too, is inside the weakening quadrant, but it is improving sharply on its relative momentum against the broader NIFTY500 Index.
The IT index is also improving its relative momentum while staying inside the lagging quadrant along with the Realty index. The BankNifty has rolled inside the lagging quadrant, and the financial services group also continues to languish inside this quadrant. All these groups are likely to relatively underperform the broader markets.
The FMCG and the consumption pack are firmly inside the improving quadrant; they are expected to do well over the coming week.
Important Note: RRG™ charts show the relative strength and momentum for a group of stocks. In the above Chart, they show relative performance against NIFTY500 Index (Broader Markets) and should not be used directly as buy or sell signals.
Milan Vaishnav, CMT, MSTA
Consulting Technical Analyst
www.EquityResearch.asia | www.ChartWizard.ae


