In the previous weekly technical note, it was mentioned that, given the shortened trading week with two trading holidays, the equity markets may exhibit a tentative and cautious bias and may not show any major move on the upside. While keeping in line with this analysis, the NIFTY continued to retrace through the week and closed on a corrective note. Despite this being just a three-day trading week, the markets saw themselves moving in a 336-point range. While continuing to resist the key technical levels, the NIFTY formed a lower top lower bottom on the charts. The headline index ended with a net loss of 308.70 points (-1.74%) on a weekly basis.
The markets will open after a gap of one trading holiday; one trading holiday, because the second trading holiday, which was a Good Friday, had global markets closed as well. So the Indian markets will adjust to the global trade that took place on Thursday. There is the possibility of a tepid and soft start to the trading week. The start may be on a somber note, but there is a chance that the markets may see a technical pullback through the rest of the week. As per the monthly options data, the strikes of 17500 have the highest PUT OI accumulation; it is likely to provide some support through the week. In any case, since the NIFTY has closed below 17500, it would be crucial for the market to crawl above this point and keep its head above the 17500-mark.
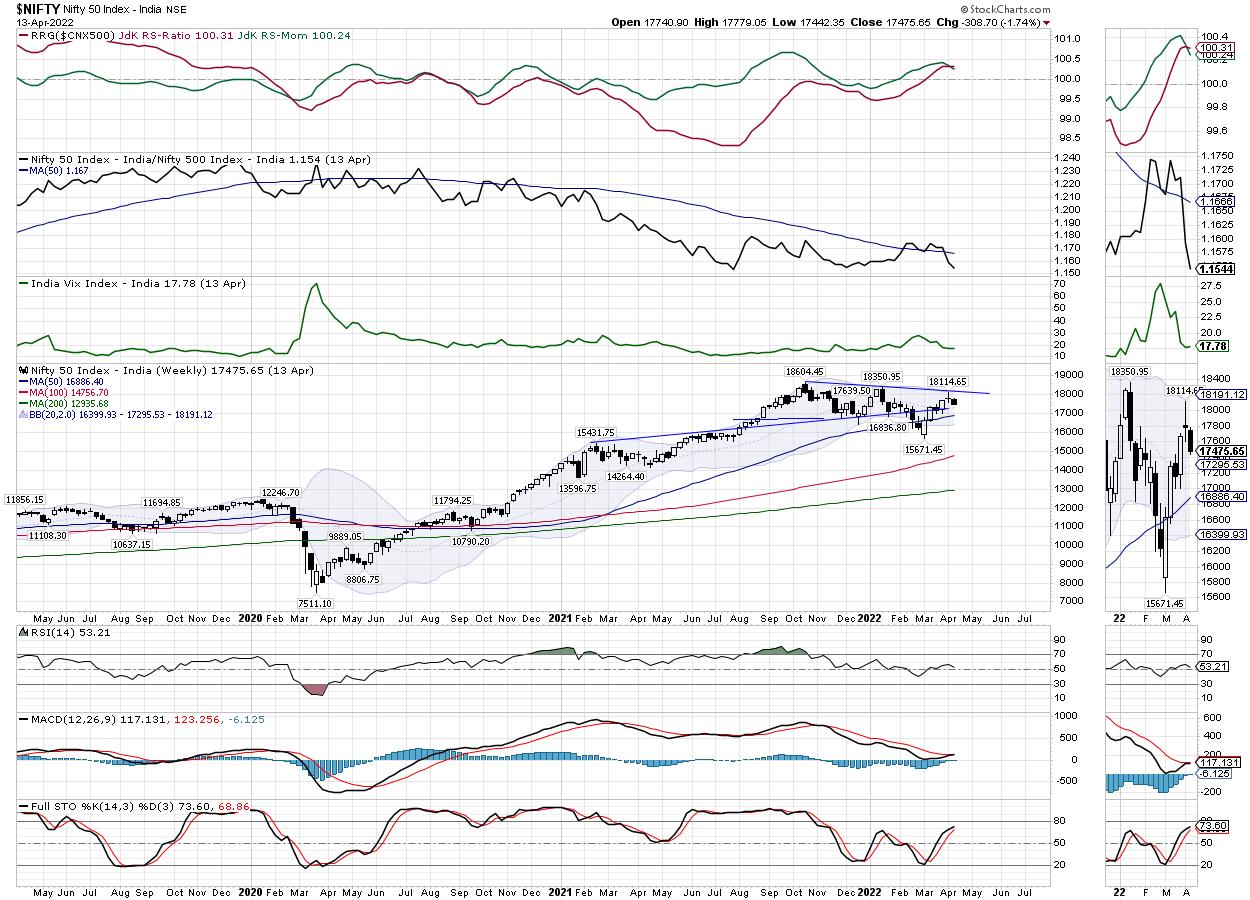
The volatility did not show much change; INDIAVIX gained just 0.55% to 17.78. The coming week is likely to see the levels of 17650 and 17800 acting as strong resistance points for the NIFTY. The supports come in at the 17380 and 17200 levels. The trading range is again likely to get a bit wider than usual over the coming days.
The weekly RSI is 53.20; it stays neutral and does not show any divergence against the price. The weekly MACD has shown a positive crossover; it is now bullish and above the signal line.
Following the formation of Doji in the week before his one, the NIFTY has formed a black body with a lower top and lower bottom. This makes the high point of the Doji candle, 18114, a strong resistance for the NIFTY in the near term.
The pattern analysis also confirms this picture. The formation of the Doji in the week before this one was near a pattern resistance of a falling trend line. This trend line started from the high point and joined the subsequent lower tops. This makes the zone of 18000-18200 a very strong resistance for the markets in the near term.
All and all, following the retracement seen in the previous short week, some amount of technical pullback cannot be ruled out. However, there is also a chance that the markets first open on a soft and tepid note, then catch up from there. In any case, it is likely that the action in the markets stays highly stock- and sector-specific in nature. It would be prudent to stay put in low beta and defensive packs like IT, Pharma, Consumption, FMCG and PSE stocks. While avoiding shorts, all downsides must be used to pick select stocks while keeping leveraged exposures at modest levels.
Sector Analysis for the Coming Week
In our look at Relative Rotation Graphs®, we compared various sectors against CNX500 (NIFTY 500 Index), which represents over 95% of the free float market cap of all the stocks listed.
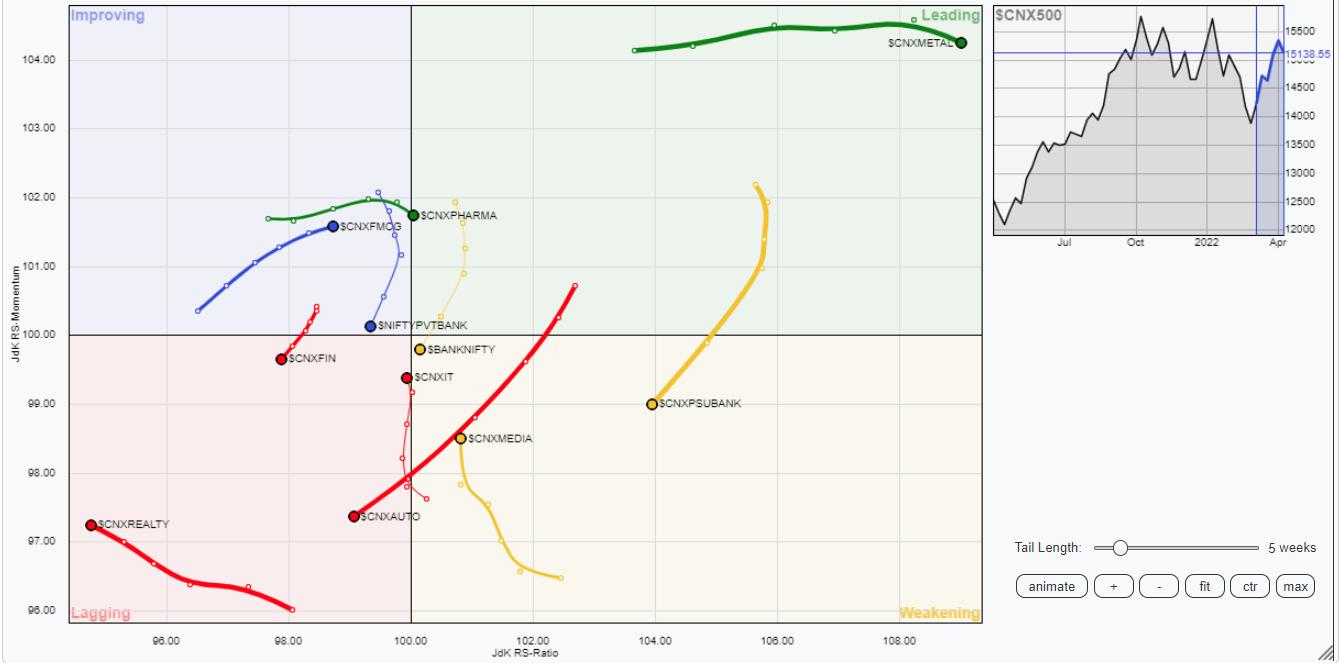
Our analysis of Relative Rotation Graphs (RRG) does not show any major change in the sectoral setup that was witnessed in the previous week. The Energy, Metal, Commodities and PSE indexes are inside the leading quadrant and are expected to relatively outperform the broader NIFTY500 index. The Pharma Index has rolled inside the leading quadrant; this sector is also likely to relatively outperform the broader markets.
The PSU bank has drifted further inside the weakening quadrant. NIFTY Media is also inside the weakening quadrant, but it is seen improving its relative momentum against the broader markets. The Infrastructure Index and BankNifty remain inside the weakening quadrant and may lag in their relative performance.
The IT Index has again drifted inside the lagging quadrant, but, on a broader note, the trajectory of the tail is rising and continuing to improve on its relative momentum. The Realty Index and MidCap 100 index are also inside the lagging quadrant, but their relative momentum is improving. On the other hand, the Auto and the Financial Services groups are also inside the lagging quadrant, but continue to languish on the relative momentum front.
Relative outperformance can also be expected from the FMCG and Consumption index, as they are firmly placed inside the improving quadrant.
Important Note: RRG™ charts show the relative strength and momentum for a group of stocks. In the above Chart, they show relative performance against NIFTY500 Index (Broader Markets) and should not be used directly as buy or sell signals.
Milan Vaishnav, CMT, MSTA
Consulting Technical Analyst
www.EquityResearch.asia | www.ChartWizard.ae


