In the truncated week that went by, the NIFTY 50 Index ($NIFTY) traded much on the analyzed lines. Despite staying volatile, it largely remained buoyant while it extended its move on the upside.
In the previous week's technical note, there was a categorical mention of the possibility of the NIFTY Bank Index (Banknifty) playing a catch-up given its relative underperformance. This index closed at a new high and the NIFTY closed at its fresh 52-week high while being a whisker away from the lifetime high point of 18604. In the four-day trading week, the index moved in a 392.90-point range before closing with a net gain of 232.55 points (+1.28%).
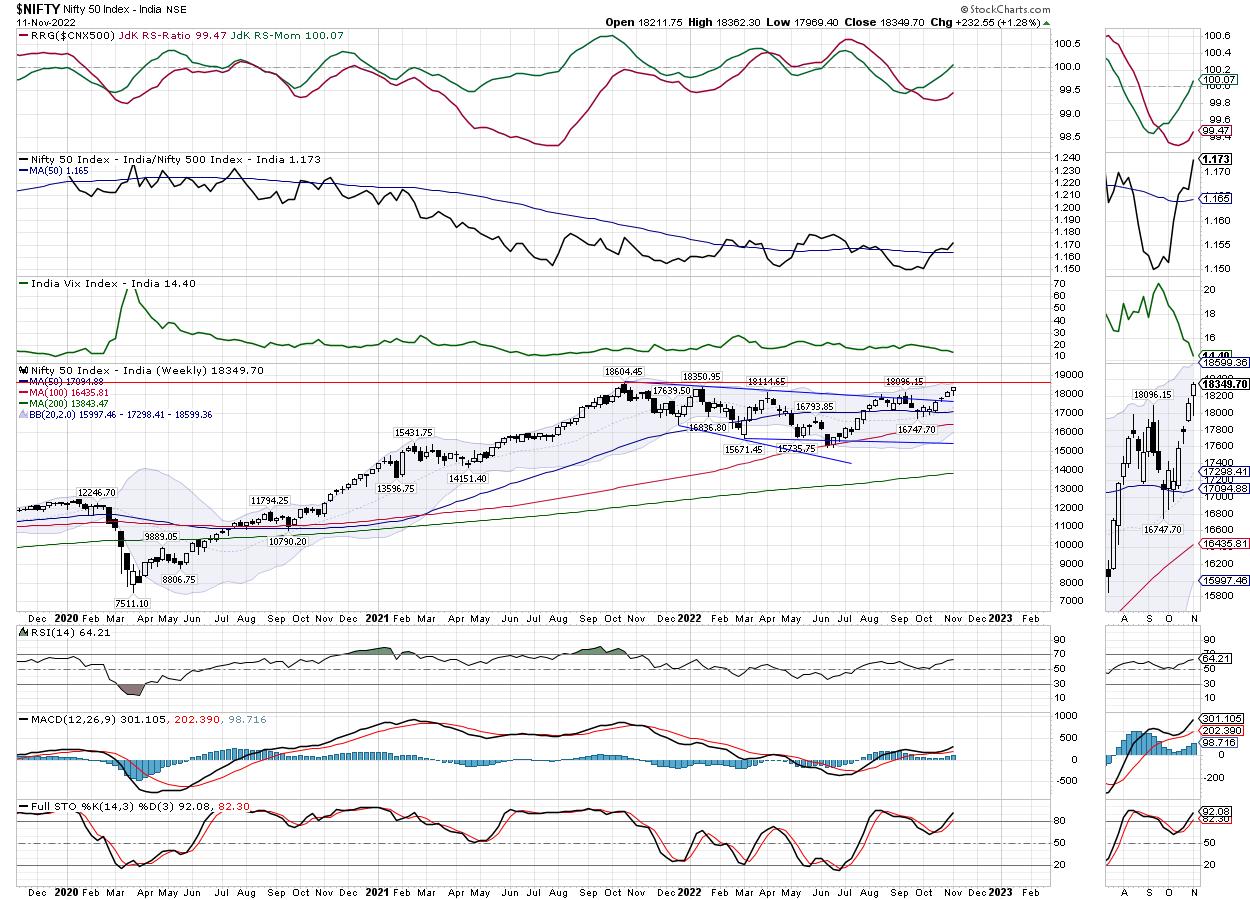
From a technical perspective, two distinct scenarios might unfold over the coming week. First, the headline index NIFTY50, which is now within a striking distance of its lifetime high point of 18604, may start seeing some resistance as it approaches the higher levels. Secondly, there are strong possibilities for the Banknifty to stage a breakout if it can keep its head above 42000 levels. If this does not happen, we may see both indices consolidate at higher levels. In any case, if the up move is extended, it would be wiser to focus on protecting profits at higher levels as the NIFTY would approach its key resistance point in form of the previous lifetime high level.
Volatility continued to slide; INDIAVIX came off by another 7.98% to 14.40; this is one of the lowest levels seen this year. The coming week is likely to see a stable start; the levels of 18400 and 18590 are likely to act as potential resistance points. The supports come in at 18000 and 17880 levels.
The weekly relative strength index (RSI) is 64.21; it has marked a new 14-period high which is bullish. It remains neutral and does not show any divergence against the price. The weekly moving average convergence divergence (MACD) is bullish and stays above the signal line. A candle with a long lower shadow has emerged on the charts. The lower shadow is not long enough to be called a classical "hanging man" but it definitely warrants some caution, especially when it appeared following a steep up-move in the markets.
The NIFTY remains within a striking distance from the lifetime high point of 18604. The global markets are largely stable, which may help the index to inch higher. However, there are possibilities that the NIFTY starts facing resistance as it travels towards its previous high point. While Banknifty is clearly stronger in relative terms to NIFTY and may relatively outperform, it is would be a prudent approach to focus more on protecting profits at higher levels until NIFTY itself achieves a breakout from the previous high. It would be wise not to chase the final up-move toward the lifetime high of NIFTY; instead, it would be more rewarding if you focus on reducing exposures, protecting the profits, and taking some money off the table.
The markets are inherently buoyant—there are fewer possibilities of any corrective move happening. However, at the same time, possibilities of consolidation at higher levels cannot be ruled out. A cautiously positive outlook is advised for the coming week.
Sector Analysis for the coming week
In our look at Relative Rotation Graphs®, we compared various sectors against CNX500 (NIFTY 500 Index), which represents over 95% of the free float market cap of all the stocks listed.
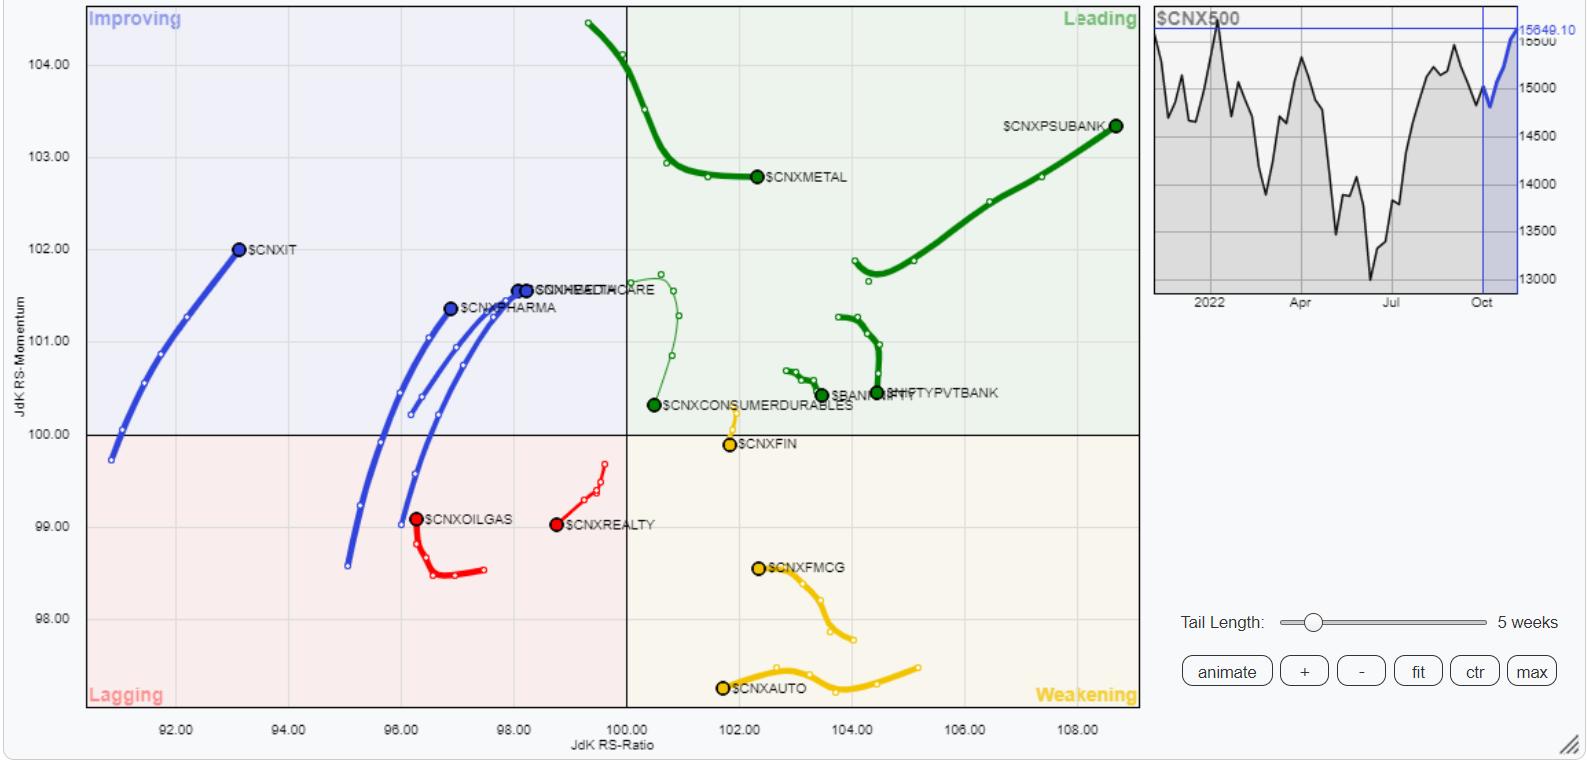
The analysis of Relative Rotation Graphs (RRG) shows Nifty Bank, Metals, and the PSU Bank Index in the leading quadrant. These groups are likely to relatively outperform the broader markets. As evident, the Metal and the PSU Bank Index show strong relative momentum against the broader markets. Further to this, the kind of distance that the PSU Bank has traveled from the center point shows the kind of Alpha that this index has generated against the benchmark.
- NIFTY Financial Services, Mid-cap 100 Index, FMCG, Consumption, and NIFTY Auto Index are inside the weakening quadrant. These may result in relative underperformance of these sectors against the broader markets.
- NIFTY Energy and NIFTY Realty Indexes continue to languish inside the lagging quadrant; they may continue to show weak relative performance as well against the NIFTY500 index.
- NIFTY Pharma, PSE, Infra, Media, IT, and the Commodities Indexes are inside the improving quadrant. They may continue to show improvement in their relative momentum and are likely to put up a good show against the broader markets.
Important Note: RRG™ charts show the relative strength and momentum for a group of stocks. In the above Chart, they show relative performance against NIFTY500 Index (Broader Markets) and should not be used directly as buy or sell signals.
Milan Vaishnav, CMT, MSTA
Consulting Technical Analyst
www.EquityResearch.asia | www.ChartWizard.ae


