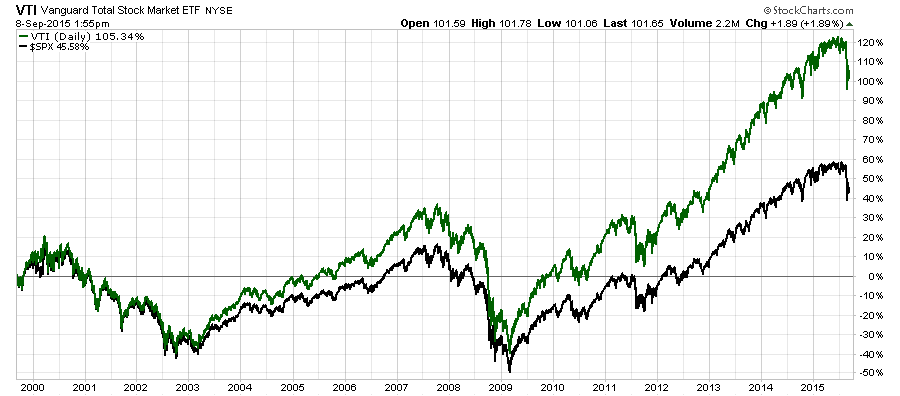
 Far too many investors assume (wrongly) that if two equities – such as the S&P 500 (SPY) and the Vanguard Total Market ETF (VTI) – have a .99 correlation (as they do), then they are interchangeable investments. They expect their performance to be very similar as well. Wrong!
If you’d like a short primer on “correlation coefficients”, please read my blog.
Truthfully, what’s required is a one-two combination. Correlations amongst equities must be considered in parallel with respective performance in the construction of any prudent Asset Allocation profile. Note the performance chart below that shows how these two highly correlated equities (.99 correlation) achieve very different performance results. VTI actually outperforms SPY by over 100%.
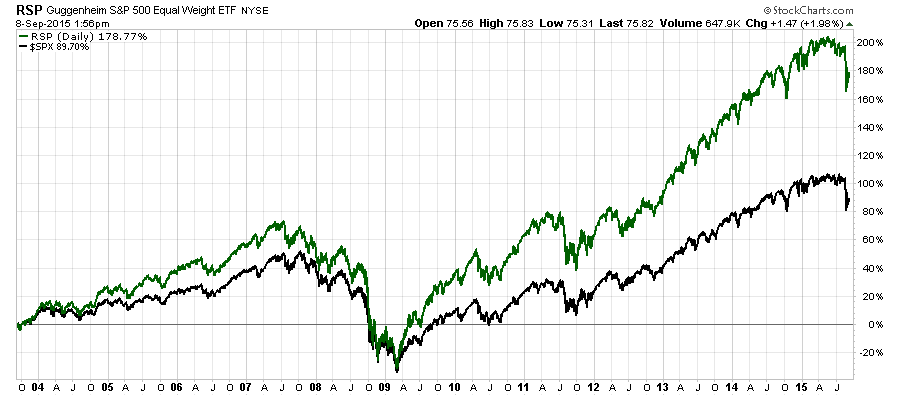
Similarly, the Large Cap US Blended Category (represented by the exchange traded fund RSP) is also highly correlated to the S&P 500 (correlation equals .97). Notice that it also significantly outperformed its highly correlated brother.
Granted, SPY does have a slightly higher dividend yield which is not reflected on the chart, and that would narrow the performance spread just a bit.
The point here is that for proper asset allocation construction, correlations between equities must always be considered in combination with actual historical performance. This is something we will dig into deeper at our Asset Allocation Seminar on October 17, 2015 (see the link below).
NOTE: The correlations quoted here were calculated based on three years of monthly data through August 31, 2015.
Trade well; trade with discipline!
-- Gatis Roze MBA, CMT
Developer of the StockCharts.com Tensile Trading ChartPack.
Presenter of the Tensile Trading DVD, Stock Market Mastery.
P.S. Click HERE for information on my future appearances & seminars.
October 17th, 2015- ASSET ALLOCATION WORKSHOP with Gatis Roze & Chip Anderson.
P.P.S. For both convenience & consistency, please click HERE to automatically receive my blog once a week as soon as it comes out.


