|
|
Triangles and pennants look the same, but their timeframes and expectations are different. Pennants are short-term patterns that form after a steep advance or sharp decline. Pennants typically extend 1-3 weeks, after which a continuation of the prior move is expected. Anything longer is probably a triangle. Triangles are medium-term or long-term patterns that form independent of the prior move. There are no directional expectations. It depends on the direction of the trendline break.
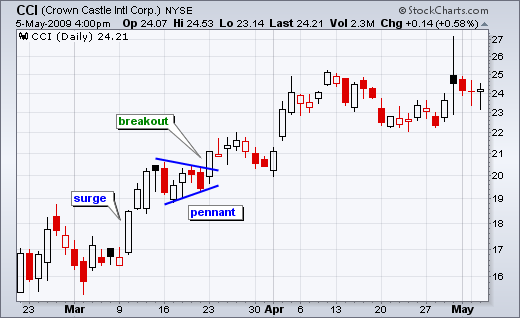
The first chart shows Crown Castle (CCI) with a bullish pennant in March 2009. Notice that the stock surged with a sharp advance in early March and then consolidated with the pennant. Pennant represents a rest after a steep surge or sharp decline. The contracting trendlines reflect a narrowing range as the pennant unfolds. The subsequent break signals a continuation of the prior move. In this case, the upside breakout signaled a continuation of the prior advance.
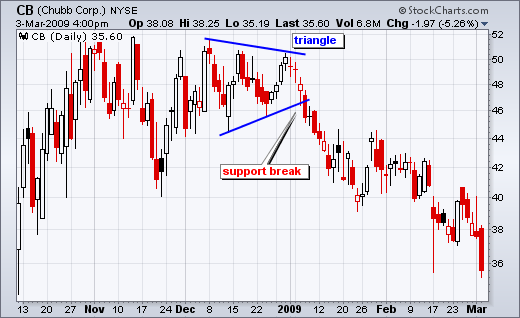
Triangles form as the range contracts over a period greater than three weeks. As noted above, they can form at any place on the chart: after an advance, after a decline or as part of a trading range. Chubb (CB) formed a triangle in December that lasted 4-5 weeks. After a rather wide range, the stock formed a lower high and a higher low as the range contracted. Triangles are neutral until the trendline break. In this case, Chubb broke the lower trendline for a bearish signal.
For more on pennant, triangles and other patterns, see Technical Analysis of the Financial Markets by John J. Murphy.


Posted by: John Martin June 27, 2009 at 15:20 PM
Posted by: Arthur Hill June 29, 2009 at 14:55 PM