|
|
There are three types of gaps: breakaway, runaway and exhaustion. As the name implies, breakaway gaps trigger a resistance or support break. This can be part of a pattern or simply a consolidation break. Runaway or common gaps occur within an existing trend. These simply signal a continuation of the trend. Exhaustion gap are tricky because the gaps is in the direction of the trend. However, an exhaustion gap signals the last hurrah as prices quickly reverse.
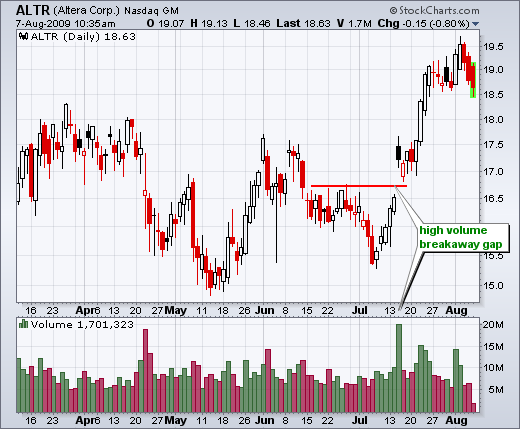
The first chart shows Altera (ALTR) with a breakaway gap on high volume. Notice how the stock started moving higher in early July and then accelerated higher with the high-volume gap. This breakaway gap held as the stock continued above 19.
The second chart shows Gamestop (GME) with an exhaustion gap in November 2008. Within a clear downtrend, the stock gapped below 20 with high volume for the sellers last hurrah. This gap did not hold long as the stock surged back above 20 with a few days. After a 5-day pullback in early December, the stock surged above 22.5 in mid December to complete the reversal.
The third chart shows MMM with a runaway gap in July. Runaway gaps are sometimes referred to as common gaps. The stock was already in an uptrend and broke ascending triangle resistance in mid July. After edging to 65, the stock gapped up and forged a long white candlestick with high volume on 23-July. This gap was clearly after the breakout and within the current uptrend, which makes it a runaway gap. You can learn more about gaps by reading John Murphy's free eBook Charting Made Easy.


