|
|
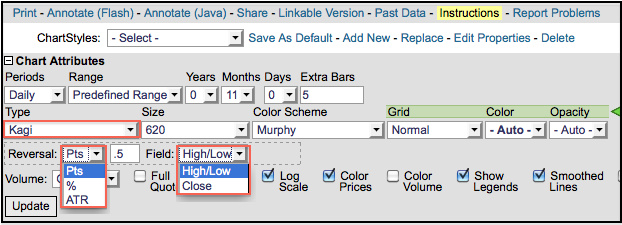
Kagi charts plot minimum price changes independent of time, which makes them similar to P&F charts. Kagi charts can be plotted by selecting “Kagi” as a chart “Type” under “Chart Attributes”. Chartists must then select a reversal amount and then a price field. Reversal amounts can be specific points, a set percentage or a fluctuating Average True Range (ATR). I would recommend points or percentage to insure uniformity. The choice between close or high-low depends on desired sensitivity.

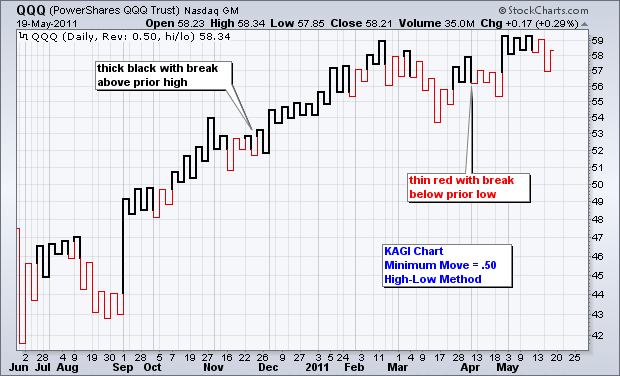
The chart below shows QQQ with a Kagi plot set at .50 and based on the high-low price field. This means that price changes must be at least 50 cents to warrant movement on the chart. Price movements less than 50 cents are ignored. Because some price movements are ignored, Kagi charts are independent of time. This is why weeks and months are not uniformly distributed across the x axis.

Click this image for a live chart.
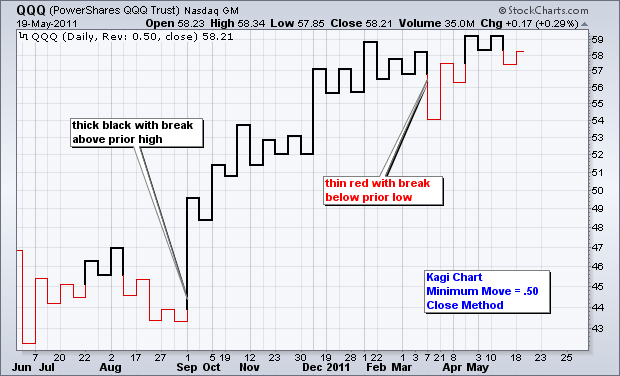
The second chart shows QQQ with a Kagi plot set at .50 and based on closing prices. Notice that there are far fewer reversals when closing prices are used. This is simply because volatility is lower when the high-low range is ignored. Kagi reversals occur when prices move above a prior peak or below a prior trough. In this regard, Kagi charts are good for identifying support or resistance breaks. The color-coding makes it easy to define uptrends and downtrends as well.
Click this image for a live chart.


