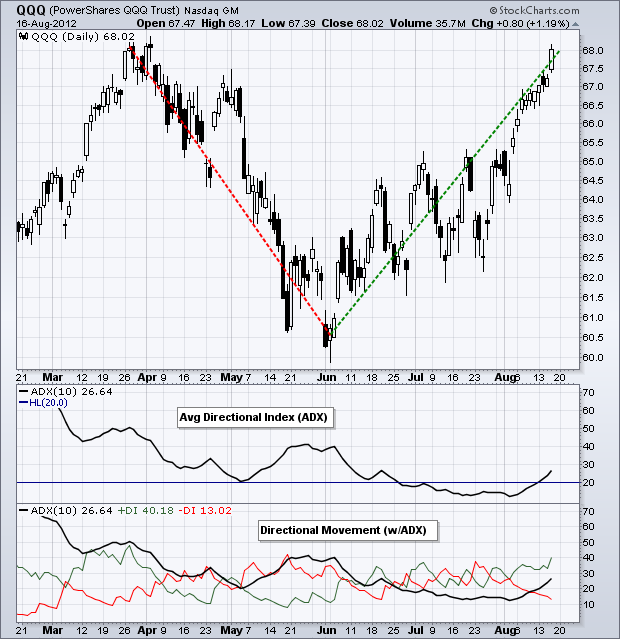
StocksCharts.com now provides two versions of the Average Directional Index (ADX). In the indicators drop down list, chartists can choose between Avg Directional Index (ADX) and Directional Movement (w/ADX). The first version shows ADX by itself, usually as a single black line. ADX measures the strength of the trend and does not have a directional bias. High ADX readings (>20) reflect a strong trend, while low ADX readings (<20) reflect a weak trend or possible trading range.
Click this image for a live chart.
The chart above shows QQQ with the two versions. I chose 10 periods instead of 14 to increase indicator sensitivity. As its name implies, chartists can assess direction using Directional Movement (w/ADX). This indicator group consists of Plus Directional Movement (green), Minus Directional Movement (red) and ADX (black). Directional movement is up when the green line is above the red line and down when the red line is above the green line. It is that simple. You can read more on these indicators in our ChartSchool article.


Posted by: Mike Siroky August 17, 2012 at 09:33 AM