|
|
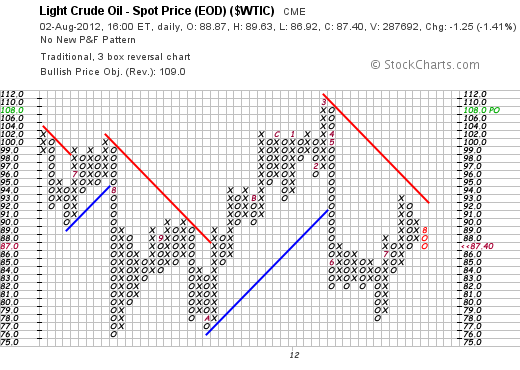
On Thursday August 2, $WTIC crude made an interesting turn.
Currently crude is in a downtrend denoted by the red line.
We have started August creating a downward column of O's. The Red 8 shows the first box in August with a move of at least $3.
You can see that since June (The red 6), we were stuck in a range into July. In July (Red 7) Crude was able to push above $87. It then pulled back, roared to $93 and has since settled back to sit just around the previous support / resistance level built in June.
Upside: If Oil can rally from this level, it would be very bullish. A push through to $93 would break the downtrend line. Looking left, $93 and $94 have been resistance. A push through there would probably allow oil to surge to $102.
Downside: If Oil goes through $86, it is bearish. A break through $84 would be a bigger warning as the price has spent a lot of time there (9 X's and O's) and should have more support. Obviously the 3 O's at $82 are a significant level. We are currently in a downtrend as indicated by the red line. The $76, $77,$78 level is the major floor for this market. The last 3 years, August has been a weak month where oil pulls back and then surges into the September, October months.
Watch crude closely for hints on a major economic trend. The big picture on the chart above is higher highs and higher lows. We are just in the trading range now.
Good Trading,
Greg Schnell, CMT


