|
|
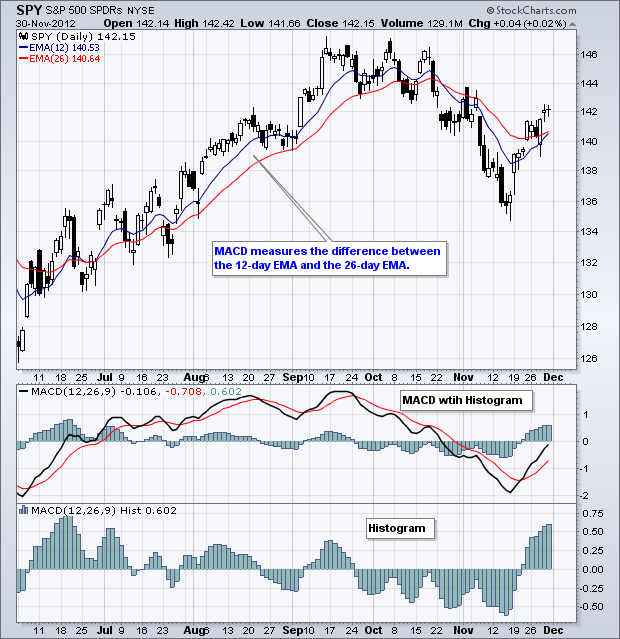
MACD consists of three components. First, there is MACD itself, which is the 12-day EMA less the 26-day EMA. Second, there is the signal line, which is a 9-day EMA of MACD. Third, there is the MACD Histogram, which plots the difference between MACD and its 9-day EMA. As an an indicator of an indicator, the MACD Histogram measures the momentum of MACD.
The MACD Histogram can be used to anticipates signal line crossovers MACD because the histogram narrows as the gap between MACD and its 9-day EMA narrows. Also notice that the histogram turns up or down ahead of MACD. Overall, the histogram is negative when MACD is below its signal line and positive when MACD is above its signal line.
Click this image for a live chart.
The basic MACD indicator in SharpCharts plots MACD, its signal line and its histogram. Sharpcharts also has a stand-alone indicator for the MACD Histogram. You can read more about MACD in the Chart School.


