|
|
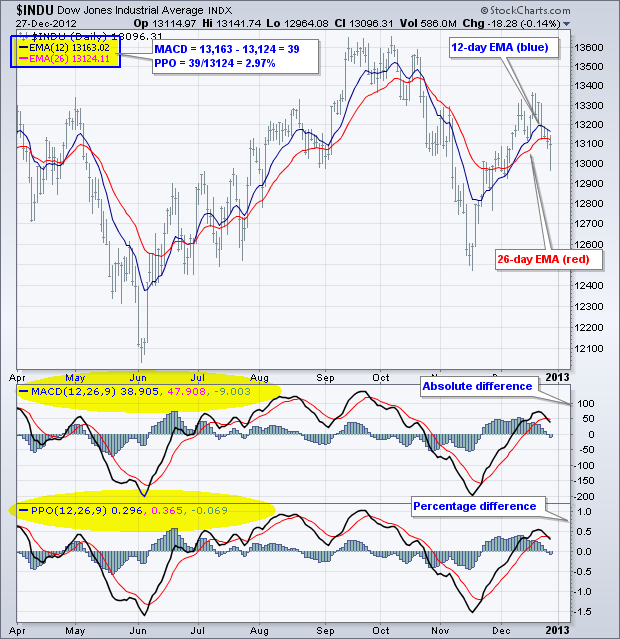
MACD and the Percent Price Oscillator (PPO) are momentum oscillators that measure the difference between two moving averages. MACD(12,26,9) is the absolute difference between the 12-day and 26-day exponential moving averages. PPO(12,26,9) takes MACD one step further by showing the percentage difference between these two moving averages. The PPO is the difference of the two EMAs divided by the 26-day EMA. A 9-day EMA is applied to MACD and the PPO to act as a signal line.

Click this image for a live chart
The difference between MACD and the PPO can be seen on the Dow chart. Notice that MACD values are influenced by the price of the underlying security. The higher the prices are, the larger the MACD values, both positive and negative. MACD for the Dow fluctuated between +150 and -200. Basically, the PPO values are the MACD values divided by the 26-day EMA. The PPO fluctuated between +1.1% and -1.6%. You can read more on MACD and the PPO in our ChartSchool.


