|
|
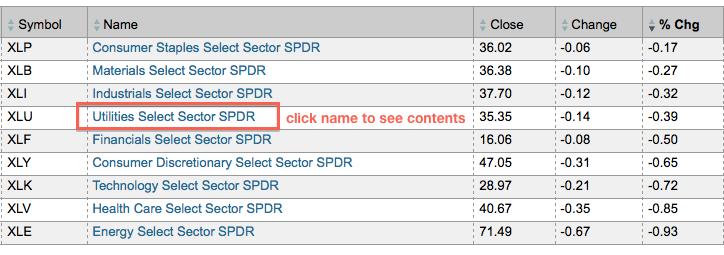
The StockCharts Sector Summary gives chartists the ability to drill down into sectors and industry groups. As it’s name implies, the Sector Summary starts with the nine stock market sectors. Each one of these names has a link. When clicked, chartists will be taken to the industry group level within that sector. In this example, I clicked on the utilities sector to see the industry groups within.


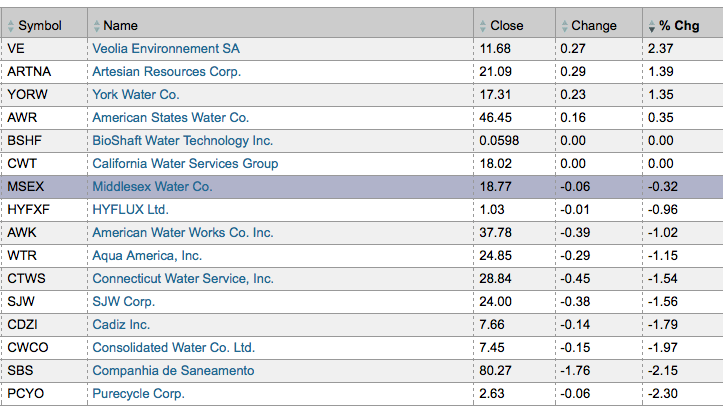
The second image shows the five industry groups that make up the utilities sectors. Notice that these tables can be sorted by the column headings (symbol, name, close, change or %chg). The default sort is %Chg to show the strongest industry groups at the top. Chartists can click the DJ US Water Utilities Index ($DJUSWU) to see the stocks within this industry groups. Click on each name to see an individual SharpChart.

Click this image for a live version.


The second image shows the five industry groups that make up the utilities sectors. Notice that these tables can be sorted by the column headings (symbol, name, close, change or %chg). The default sort is %Chg to show the strongest industry groups at the top. Chartists can click the DJ US Water Utilities Index ($DJUSWU) to see the stocks within this industry groups. Click on each name to see an individual SharpChart.

Click this image for a live version.


Posted by: Peter Stoehr December 17, 2012 at 20:43 PM