|
|
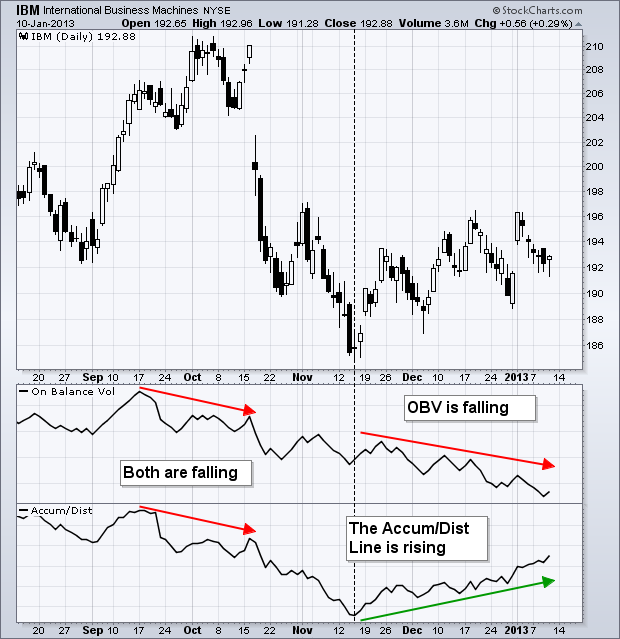
On Balance Volume (OBV) and the Accumulation Distribution Line are cumulative volume-based indicators. The difference between these two indicators is based on the closing price reference. OBV compares the close with the prior period’s close, while the Accumulation Distribution Line compares the close with the period’s high-low range. These two indicators sometimes diverge because they are calculated differently.
Developed by Joe Granville, OBV is based on a relatively simple calculation. Volume is added when the stock closes above its prior close and subtracted when the stock closes below its prior close. Granville theorized that volume leads price. Gains or losses on high volume are significant, while gains or losses on low volume are deemed less significant.

Developed by Marc Chaikin, the Accumulation Distribution Line is based on the level of the close relative to the high-low range for the period. A close above the midpoint of the high-low range is positive (between 0 and +1), while a close below the midpoint is negative (between 0 and -1). At the extremes, a close on the high equals +1, a close on the low equals -1 and a close at the exact midpoint equals 0. This number is then multiplied by the period’s volume to create the periodic values. Closes near the high on high volume will push the Accumulation Distribution Line higher, while closes near the low on high volume will push it lower. You can read more about OBV or the Accumulation Distribution Line in our ChartSchool.
Developed by Joe Granville, OBV is based on a relatively simple calculation. Volume is added when the stock closes above its prior close and subtracted when the stock closes below its prior close. Granville theorized that volume leads price. Gains or losses on high volume are significant, while gains or losses on low volume are deemed less significant.

Developed by Marc Chaikin, the Accumulation Distribution Line is based on the level of the close relative to the high-low range for the period. A close above the midpoint of the high-low range is positive (between 0 and +1), while a close below the midpoint is negative (between 0 and -1). At the extremes, a close on the high equals +1, a close on the low equals -1 and a close at the exact midpoint equals 0. This number is then multiplied by the period’s volume to create the periodic values. Closes near the high on high volume will push the Accumulation Distribution Line higher, while closes near the low on high volume will push it lower. You can read more about OBV or the Accumulation Distribution Line in our ChartSchool.


