|
|
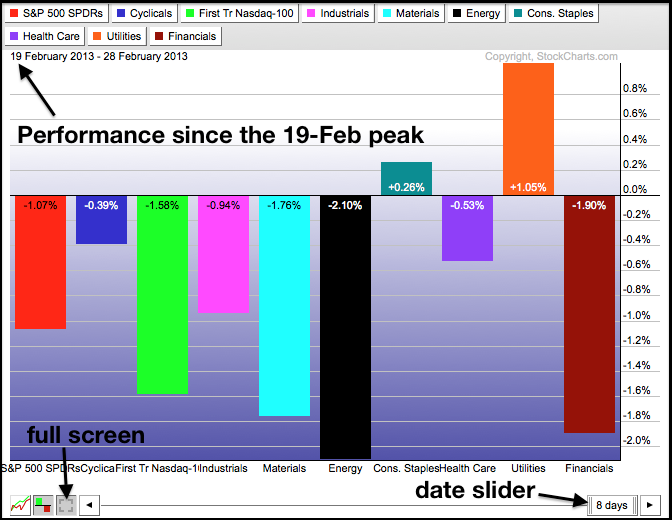
Our HTML5 PerCharts give chartists the flexibility to choose an exact date range using the date slider at the bottom. After opening a PerfChart, double click on the date slider and enter the desired number of days. For example, the S&P 500 ETF (SPY) has yet to exceed its 19-February peak, which makes this date important. Chartists could focus on sector performance since this peak by entering “8” for the number of days in the date slider. This feature makes is possible to base performance on a specific peak or trough in the market.

Click this image for a live chart
Chartists can also resize their PerfCharts using the “full screen” icon. Click this icon to expand the PerfChart. Users can then click and drag the corners to resize their browser window and the PerfChart. Click the full-screen icon again to return to normal viewing. This resizing option is handy for taking screen shots and sharing your PerfCharts with others, such as CNBC and Bloomberg! You can learn more about PerfCharts by watching our video tutorials.


