
|
This article explains two options for adding price labels to a SharpChart. There is also a video at the end. For the first option, users can check the "price labels" box in the Chart Attributes section under the SharpChart. Click "update" and the chart will refresh with price labels on key highs and lows. A close-only chart will show price labels for the closing levels. A bar or candlestick chart will show price labels for the period high or low. These price levels make it easier to quantify support and resistance levels.
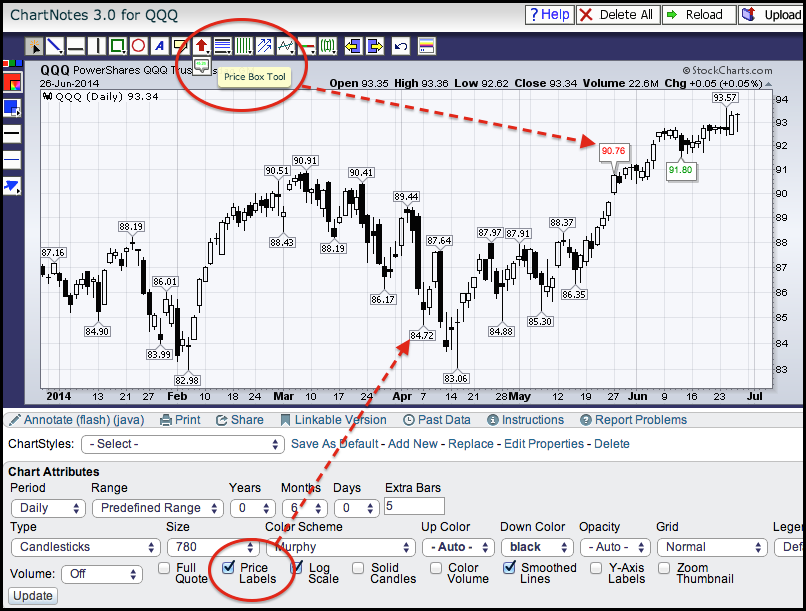
Chartists can also add individual price labels using the "price box tool" on the ChartNotes workbench, which is what we use to annotate a chart. The icon for the price box tool is under the "arrow tool" icon. Simply hover over the arrow tool and the other icon will appear. Click to select, move to a price bar and click to add a price box. This will display the closing price with a small callout box.
