|
|
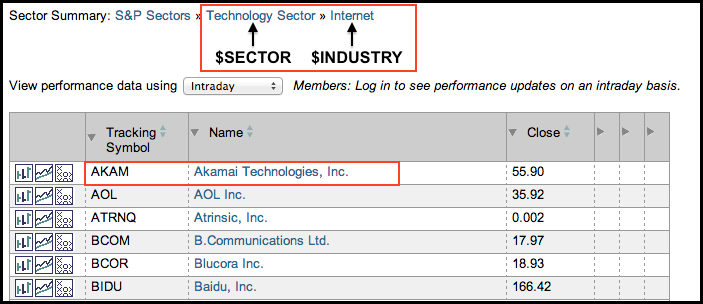
When charting a single stock, StockCharts users can view the corresponding sector and industry group by using the symbols $SECTOR and $INDUSTRY, respectively. The sector and industry group will correspond with the Sector Summary. The image below shows a screen shot from the internet industry group, which is part of the technology sector. Plotting the symbols $SECTOR and $INDUSTRY with Akamai (AKAM) would show the Technology SPDR (XLK) and the DJ US Internet Index ($DJUSNS).

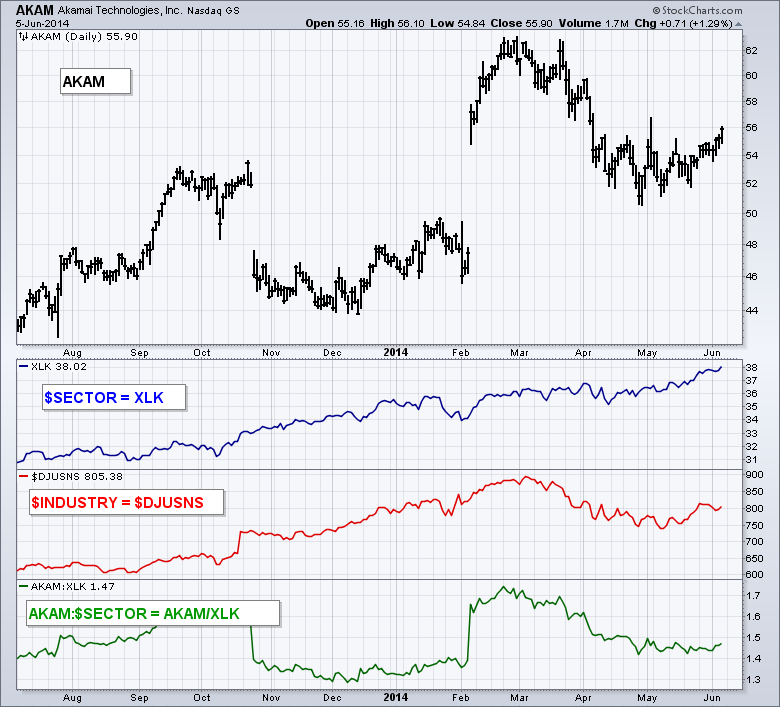
The chart below shows Akamai in the main window with $SECTOR as the first indicator, $INDUSTRY as the second indicator and AKAM:$SECTOR as the third indicator. Notice how the charting engine automatically pulled up XLK for the sector, $DJUSNS for the industry group and AKAM:XLK for the price relative. This makes it easy to compare performance and identify the industry group or sector.
And now for the really cool part. You can save this chart as a ChartStyle and easily add the sector and industry group to any stock. If I were to change the main symbol from AKAM to BIIB, $SECTOR would automatically change to the HealthCare SPDR (XLV) and $INDUSTRY would change to the DJ US Biotech Index ($DJUSBT). These means any stock will be matched with its corresponding sector and industry group. While most stocks have sector and industry groups assigned, keep in mind that there are some obscure stocks that do not have assigned sectors and industry groups.


