|
|
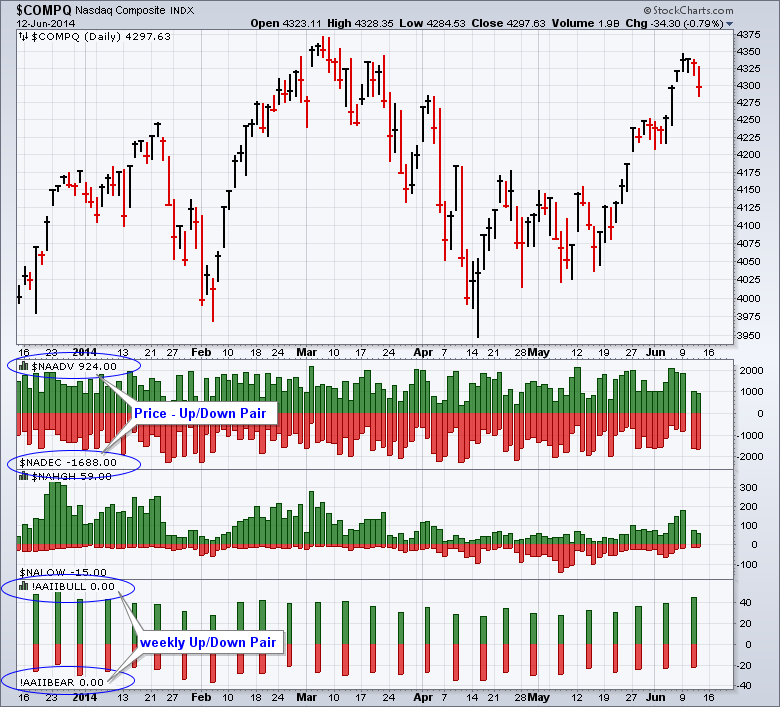
Some indicators come in bullish-bearish pairs. Examples include advances and declines, up volume and down volume, new highs and new lows, and percent bulls and percent bears. These bullish-bearish pairs can be plotted as an up-down pair using a special indicator (Price - Up/Down Pair). Select this indicator and then enter the two symbols separated by a comma. The first symbol will be up (green) and the second symbol will be down (red).
The chart above shows the Nasdaq in the main window with three examples in the indicator windows. The first is Nasdaq Advances ($NAADV) and Nasdaq declines. The second is Nasdaq New Highs ($NAHGH) and Nasdaq New Lows ($NALOW). These two indicators are updated daily. The third indicator is AAII Bulls (!AAIIBULL) and AAII Bears (!AAIIBEAR), which is a weekly sentiment indicator.


