|
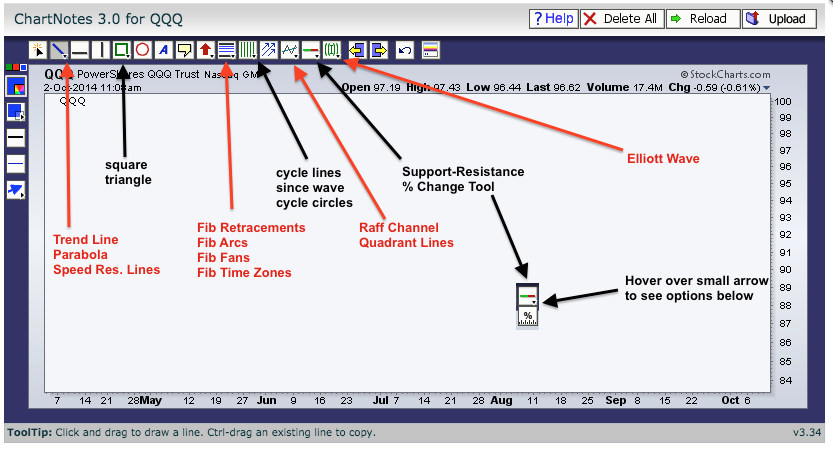
When annotating a SharpChart, there is a row of icons at the top of the ChartNotes workbench. Chartists can hover over the icons that have a small arrow in the right corner to reveal "hidden" icons for more features. The chart below shows the ChartNotes workbench with the standard tool bar at the top. The Trendline icon is in the left corner and there are two other icons underneath it (Parabola and Speed Resistance Lines). Several other icons are also singled out to show the other tools available. For example, the Percent Change Tool can be found under the Auto Support-Resistance Tool.
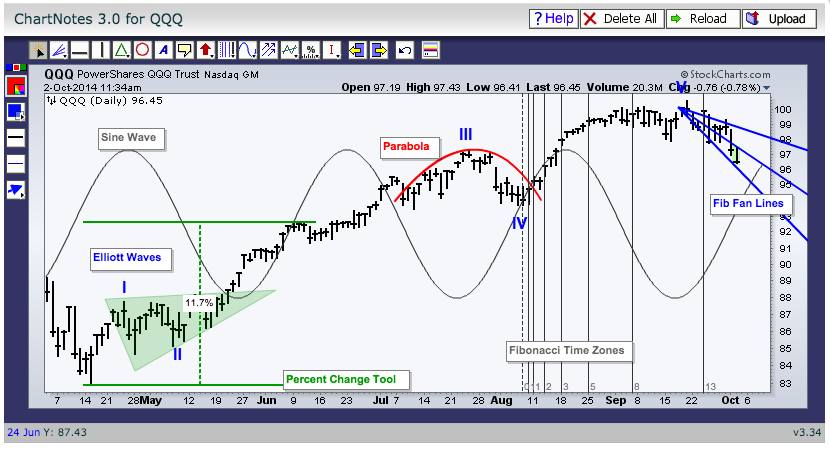
The second chart example shows how the tool bar changes once a tool is used. Notice that the Fibonacci Fan Lines, Triangle, Sine Wave and Percent Change Tool are now visible on the tool bar. This is because they were selected and used on the SharpChart. The Elliot Wave tool shows a roman numeral (I) because this style was selected. There is a lot to discover so be sure and look under the icon when you see a small arrow in the right hand corner.