|
|
Chartists can measure the difference between price and a moving average using the Percent Change Tool and the Percentage Price Oscillator (PPO). Knowing how far above or below a stock is from its moving average can help determine if it is overextended or if momentum is accelerating. Let's look at a 50-day simple moving average using Citrix as an example.
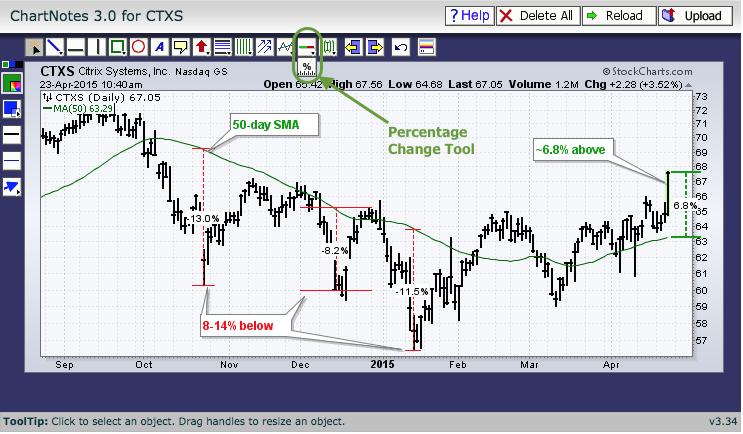
The Percent Change Tool can be found when annotating a SharpChart. The icon is in the middle of the top row under the auto support-resistance icon (green-red line). Click, drag and extend this tool to measure the difference between price and the moving average. As the example below shows, Citrix got overextended on the downside when it was 8-13% below the 50-day SMA. Notice that two of these measurements are from the low of the bar.

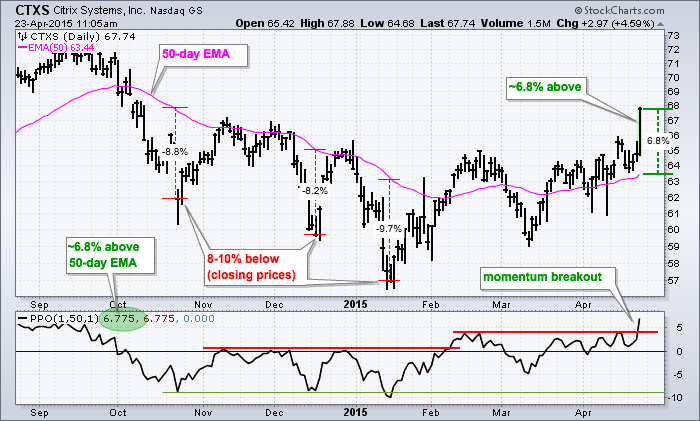
Chartists using an exponential moving average can use the Percentage Price Oscillator (PPO), which measures the difference between two exponential moving averages. A Percentage Price Oscillator set at (1,50,1) would measure the percentage difference between the close and the 50-day EMA. The last "1" is for a 1-period signal line and setting it at "1" essentially hides it.

The chart above shows the PPO dipping to the 8-10% area as closing prices moved 8-10% below the 50-day EMAs. The last price on this chart is at 67.8 and around 6.8% above the 50-day EMA. We can confirm this by measuring with the Percent Change tool. And finally, the horizontal red lines on the PPO mark prior momentum peaks in November-December and February-April. Notice how CTXS broke these prior momentum peaks in early February and again this week.


