 During my ChartCon 2018 presentation entitled “The Mindless Investor and the Mindful Investor”, I shared the technical checklist that I use to teach a disciplined process for technical analysis.
I received a question after the session on whether I had a “behavioral checklist” to help minimize the impact of behavioral biases in investment decisions. I have never had a behavioral checklist, but I spent some time thinking through what might be included.
Most behavioral biases are caused by making decisions because of your emotional state, instead of making decisions in spite of your emotional state. So how can we systematically remove emotions from the decision process?
Here is my first rough draft of a Behavioral Checklist for Investing. This is a rough draft, and I reserve the right to keep editing this over time. If you have any suggestions, please let me know on Twitter!
Dave’s Behavioral Checklist
1) What does the data say?
At the beginning of your investment process, there should be data. This sounds like a straightforward point, but it’s actually quite common to do otherwise.
We often begin our process with an investment opinion, like being bullish on a stock or bearish on a certain asset class. We then go to the data, and our brain tends to put more weight on data that supports our outlook, and less weight on data that conflicts with our point of view.
I’ve just described confirmation bias, where we search for evidence to support a preconceived notion. We can combat this by starting with the data itself, and seeing what conclusions come out of a thorough review of the data.
Charts provide a perfect opportunity to start your process with data. Instead of saying “I’m bullish on stock XYZ,” bring up the chart first and ask the question, “What is this chart telling me about stock XYZ?”
When I teach technical analysis, I never allow students to tell me they are bullish or bearish on a stock until they talk through all of the evidence on the chart. That’s how you start with the data and avoid the temptation of confirming your preexisting bias.
2) What’s the other side of the trade?
Once you’re ready to pull the trigger on the investment decision, stop and argue the other side of it. That’s right, try to convince yourself that you’re wrong.
At my previous firm, we would have an analyst serve as “devil’s advocate” to take the other side of any investment thesis. This forced you to consider both sides and either a) realize your initial assessment wasn’t good enough to execute on, or b) confirm that your thesis is worth your capital.
What this does is disorient you and force you to validate an opposing argument. One way to do this through charts is to invert the price scale. That is, to look at the chart upside down.
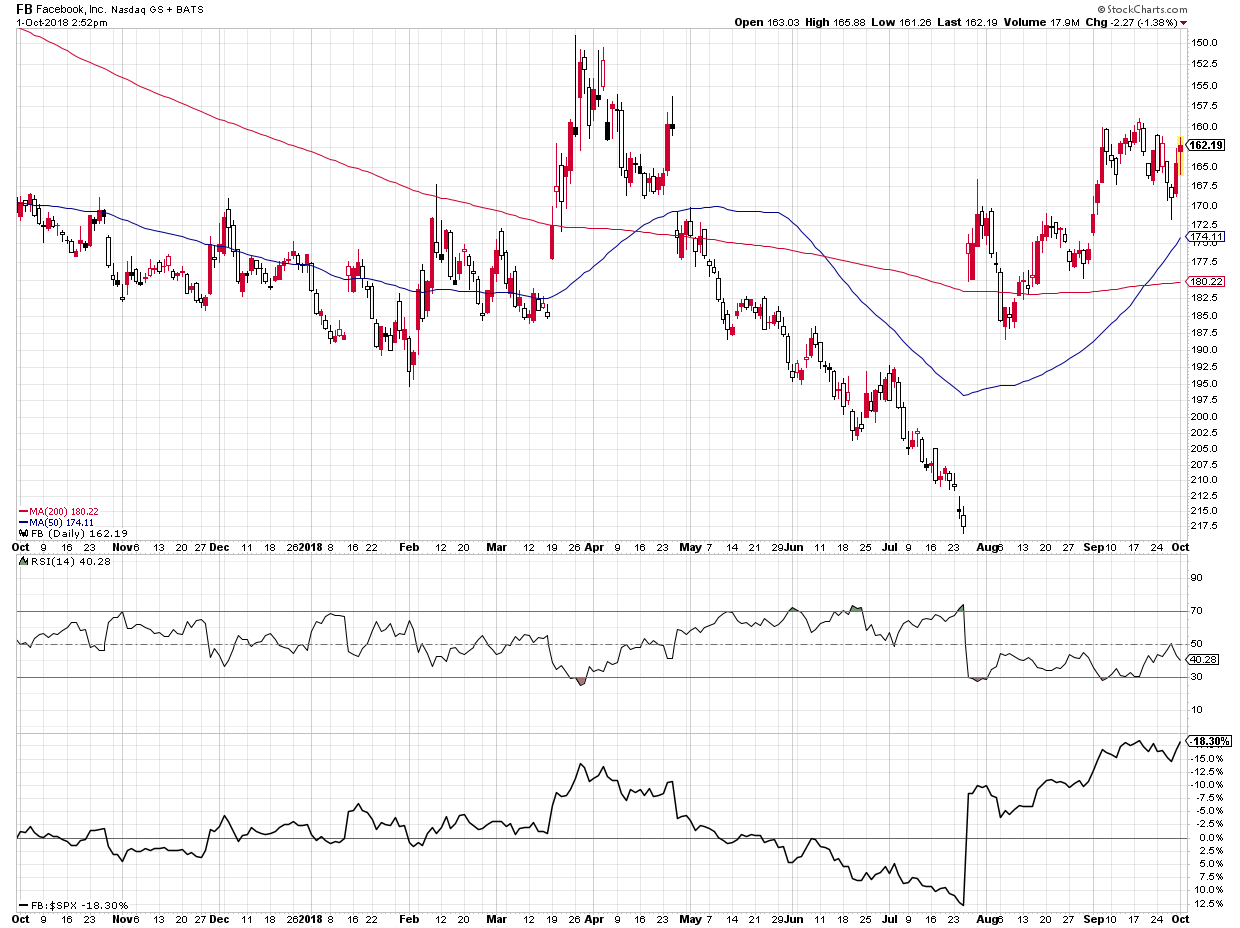 Here is a chart of FB plotted upside down. (Pro tip: to do this on stockcharts.com, simply add a minus sign “-“ before any ticker.) Does this look like a chart you would want to buy? If so, then you may want to reconsider a bullish thesis on Facebook!
3) What’s my exit strategy?
Once you have developed a thesis based on real data and validated your thesis by considering the other side of the trade, you now need to determine an exit strategy.
I don’t mean a strategy to take profits when your thesis plays out exactly as expected, I mean a stop loss strategy to exit a losing trade.
To ask a different way, “When will I admit that I was wrong?”
When a trade goes against us, it’s very easy to justify still holding the position as it slowly ravages our account. By acknowledging an incorrect thesis and exiting a bad trade before it becomes an investment, you will live to invest another day.
Once you actually own a stock, you’re vulnerable to the endowment effect, where you attribute greater value to something simply because you own it. As a result, we tend to justify owning something as its value crumbles because we’re convinced of its value.
Remember, the market is what sets the price of a stock. The price chart is telling you the value of a stock at any moment, set by the balance of supply and demand in the marketplace.
In my trading journal, any time I add a new position I include a price level or technical signal at which I will exit the position. No questions asked. Has this kept me from further gains when the price gives a false signal? Yes. But has it also gotten me out of bad trades before they’ve become climactic losses? Absolutely.
Human beings usually make decisions affected by human emotions. By following the behavioral checklist I’ve described, you will likely identify where your emotions tend to dominate your thinking and bias your decisions.
RR#6,
Dave
David Keller, CMT
President, Sierra Alpha Research LLC
Disclaimer: This blog is for educational purposes only and should not be construed as financial advice. The ideas and strategies should never be used without first assessing your own personal and financial situation, or without consulting a financial professional.
The author does not have a position in mentioned securities at the time of publication. Any opinions expressed herein are solely those of the author, and do not in any way represent the views or opinions of any other person or entity.


