 Everyone believed they had a sound approach to investment during the extended bull market of 2009-2018. When everything’s gaining in price, slowly and steadily, it’s easy for confidence in your process to become overconfidence in your process.
To quote a phrase, “Never confuse brains with a bull market.”
Through late 2017, many investors had crossed the line from bullish to euphoric. The rapid rise in Bitcoin was perhaps the best example of this euphoria - people just couldn’t imagine the market going lower.
Once the market dropped in early 2018, those investors quickly rotated from euphoric to panicked. Market participants gained confidence as the S&P moved to new highs into the fall, only to see the market once again reverse lower in dramatic fashion.
When market volatility increases, many long-term investors fall victim to what’s known as myopic loss aversion. As I explained during my ChartCon 2018 presentation, loss aversion explains how we really don’t like to lose money. In fact, we hate to lose much more than we love to win.
So what happens when faced with potential losses? Myopia is essentially "short-termism" - that is, our tendency to make decisions based on short-term information. Theoretically, this would increase market swings, creating a feedback loop of volatility!
Unfortunately, as our emotions take hold, we focus way too much on short-term market fluctuations. Every up day feels like a home run, while every down day feels like an utter nightmare. We’ve abandoned the rationality of long-term investing for the irrationality of short-term performance-chasing.
In this sort of market environment, it’s important to separate the tactical from the structural. For me, the structural trend is in the 6-12 month range, creating an image of the overall trend in a market. The tactical movements are a couple days to a couple weeks; these show the short-term fluctuations within that trend.
"Never confuse brains with a bull market."
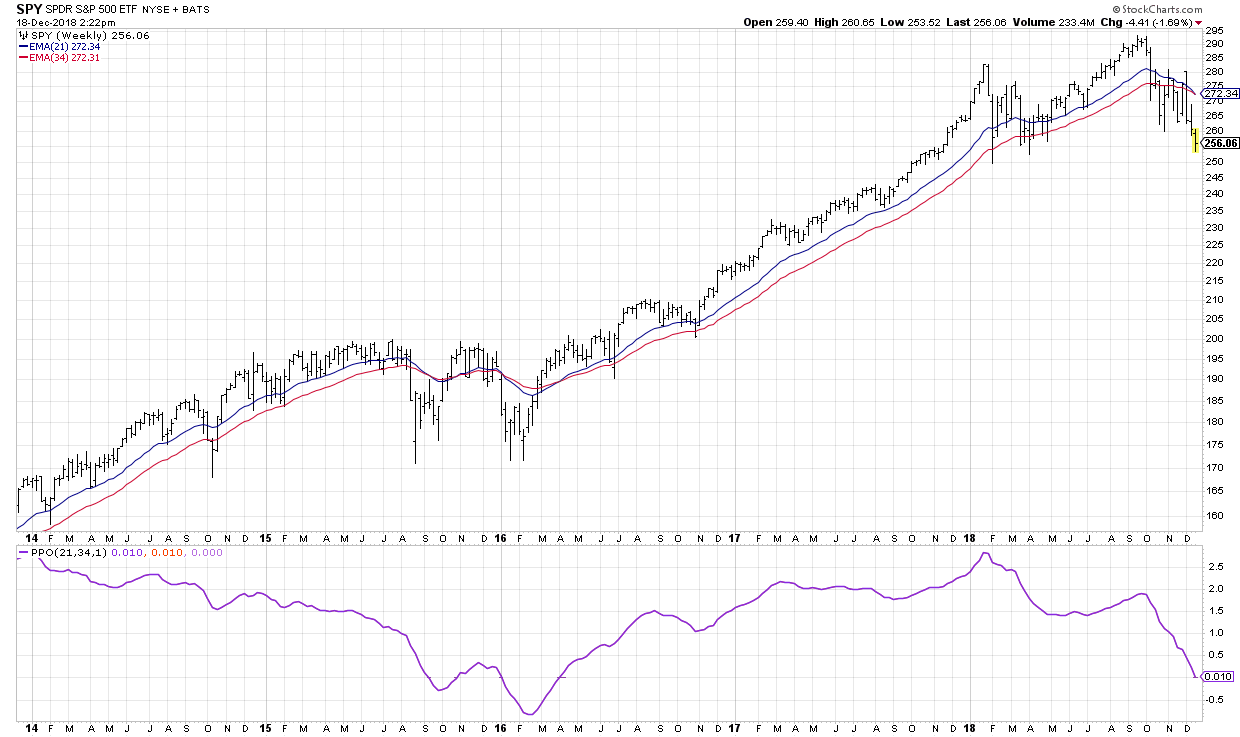
For the long-term trend, I tend to favor moving average crossover systems, which indicate the overall market direction. There is always a tradeoff between using a short enough period to capture moves before they get too extended, but also long enough to minimize whipsaws during a volatile market environment.
I tend to follow the 21-week and 34-week exponential moving averages, as well as other combinations, to identify the major trend at work for any asset. For the S&P 500, this has not yet triggered, although that model has already triggered sell signals for other cap tier indexes and global equities.
For the tactical trend, I use the daily RSI to measure short-term strength and weakness. I’m always looking for extremes (RSI < 30 or RSI > 70) as well as divergences.
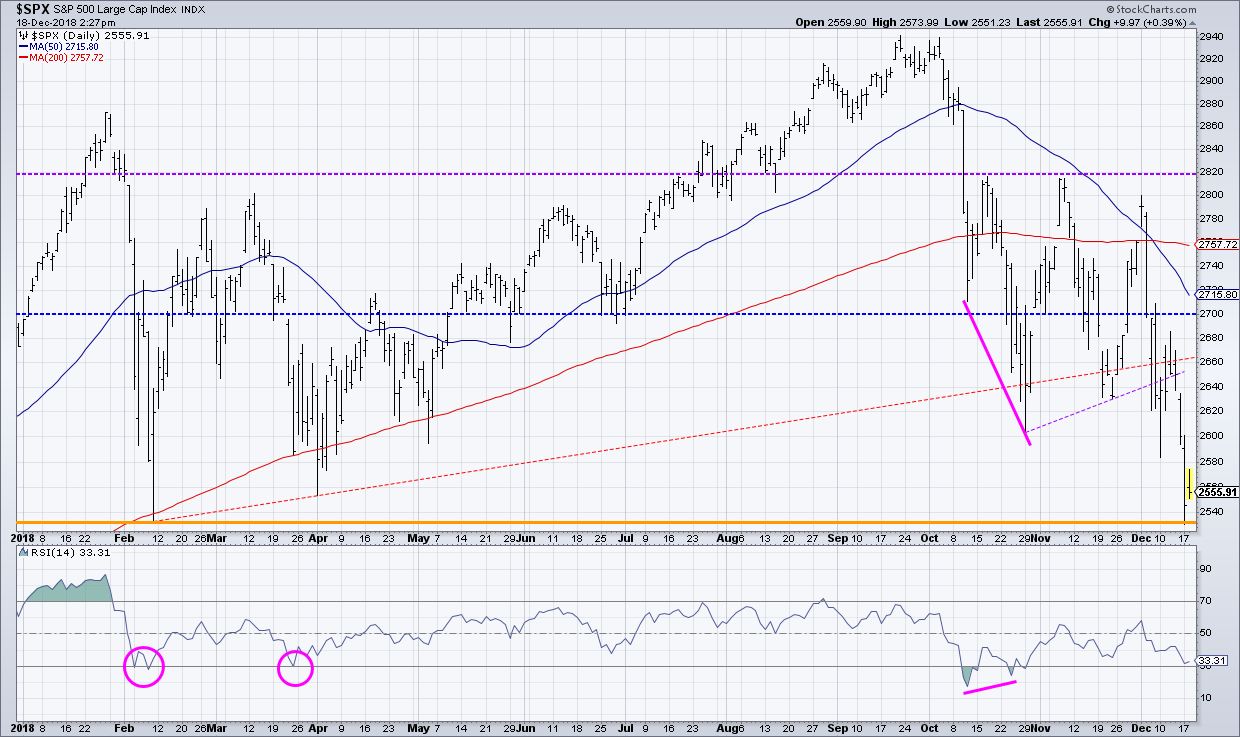
The SPX saw the daily RSI reach oversold conditions in February and again in March. Both of these coincided with ideal buying points on the tactical time frame.
In October, we saw a bullish divergence with higher lows in RSI and lower lows in price. Soon after, the S&P returned to price resistance just above 2800. At this point in mid-December, the daily RSI has not quite reached oversold levels.
I’ve found many novice technical analysts tend to have a mismatch between the timeframe in which they’re operating and the tools of which they’ve employed. By combining a long-term trend-following system with a short-term oscillator, you should be able to identify the tactical opportunities within the structural trend.
The key to avoiding myopic loss aversion is to focus on the evidence. What are the charts telling you? Only then can you make a decision that is based on the markets themselves, rather than your emotional reaction to the markets.
RR#6,
Dave
David Keller, CMT
President, Sierra Alpha Research LLC
Disclaimer: This blog is for educational purposes only and should not be construed as financial advice. The ideas and strategies should never be used without first assessing your own personal and financial situation, or without consulting a financial professional.
The author does not have a position in mentioned securities at the time of publication. Any opinions expressed herein are solely those of the author and do not in any way represent the views or opinions of any other person or entity.


