 I’ll never forget the first time I did a simulated engine cutout at altitude. I was up in the air with my instructor, preparing to do some maneuvers, when he unexpectedly reached over and pulled out the throttle. The plane lurched forward, rapidly losing altitude, while my instructor turned to me and calmly asked, “Okay, you just lost your engine. What do you do?”
What do I do?!?
Well, at that moment, I completely panicked, my heart rate increased and my palms began to sweat. Unfazed, he slowly talked me through the necessary steps:
- Airspeed to 65 KNOTS
- Fuel Shutoff Value IN
- Mixture RICH
- Fuel Selector Valve to BOTH
- Check Ignition
By going through this systematic checklist, I was able to safely navigate the plane to a suitable place to land. Crisis averted.
Many training flights later, my CFI (Certified Flight Instructor) did the same thing, yanking out the throttle at pretty much the worst possible moment. This time, however, I quickly went through the checklist, remaining calm as a I piloted the airplane toward an open field. I seem to remember yawning noisily during the process. No big deal.
The purpose of this training experience was to show me how to make rational decisions under stressful conditions. Does that sound a bit like trading to you?
When I teach novice technical analysts, I insist that they methodically go through a technical checklist to evaluate each chart. When you have completed the entire checklist, top to bottom, you've “earned the right” to declare whether you are bullish or bearish on the chart in question.
My checklist consists of seven steps, each addressing a key part of my technical toolkit:
- Dow Theory - Is the price making higher highs and higher lows, or lower highs and lower lows?
- Trend Lines - Can I draw a trend line to quantify the trend I identified in Step 1?
- Moving Averages - Where is price relative to moving averages? Are the MAs sloping up or down?
- Pattern - Are there any clearly observable price patterns?
- Support/Resistance - Where is the price relative to any important support and resistance levels?
- Confirmation - What do any additional indicators tell us about the price?
- Relative Strength - How is this stock performing relative to other stocks?
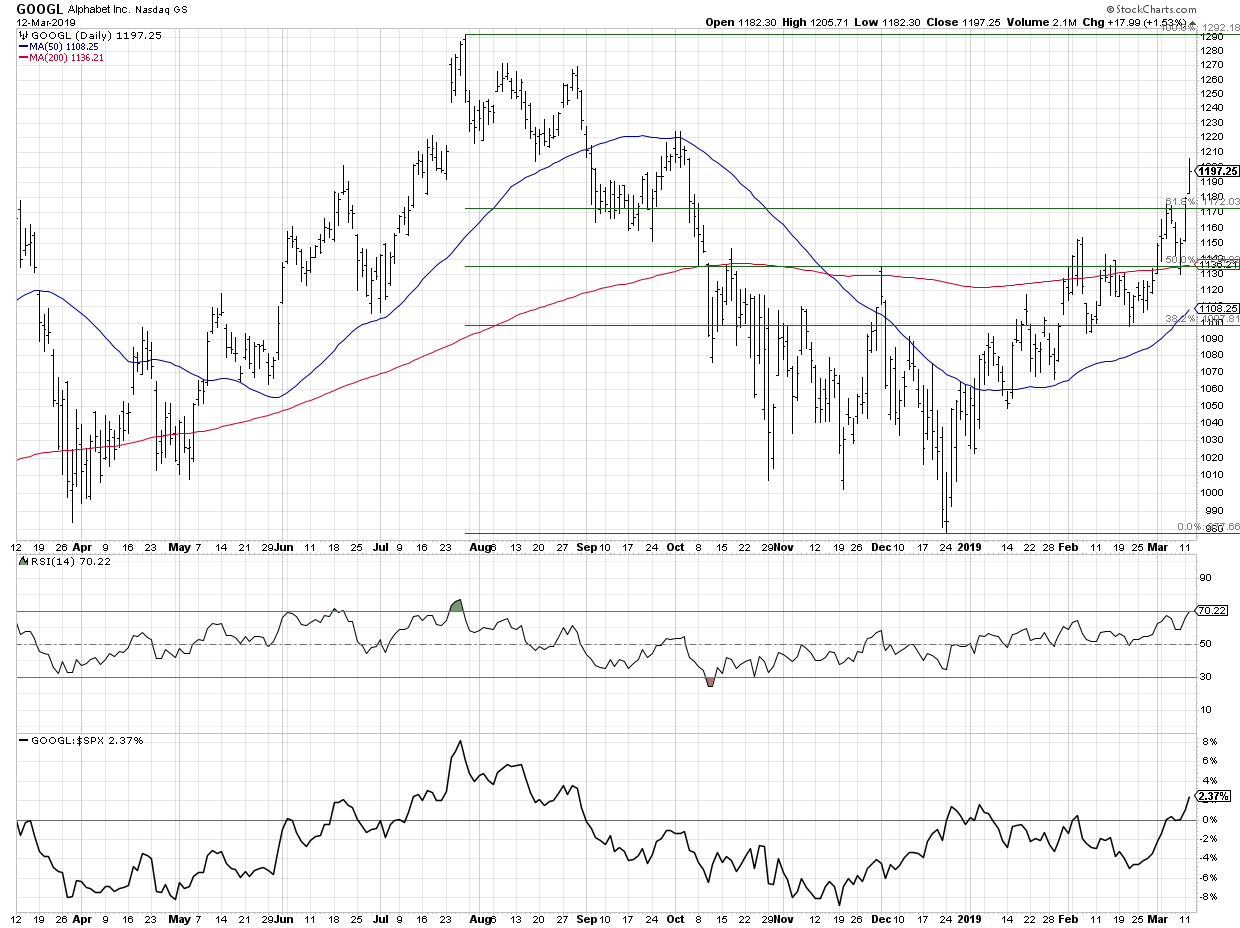
Let’s look at an example stock, Alphabet (GOOGL), and go through the steps together.
- Dow Theory - I see a consistent pattern of higher highs and higher lows. Uptrend.
- Trend Lines - I can connect the recent lows with a trend line. The trend remains consistent as long as price remains above this trend line.
- Moving Averages - The stock is trading above two upward-sloping moving averages.
- Pattern - The only real pattern I see here is a pennant pattern in February, with lower highs and higher lows. Price broke out of the pattern to the upside.
- Support/Resistance - GOOGL recently broke above the Fibonacci 61.8% level. The next resistance level would be just above 1220.
- Confirmation - RSI is in a steady uptrend, but has just reached the overbought region. We could expect a short-term pullback soon.
- Relative Strength - The stock has been outperforming the S&P 500 in recent weeks; it is close to making a new relative high.
So what is the weight of the evidence here? Based on a review of each of the seven items on my checklist, GOOGL appears to be in a bullish configuration, with a potential short-term pullback imminent.
It is very important to note that my list is certainly not “the answer” for everyone. This is a checklist I’ve developed over my career and is in line with my investment horizon and approach. Your checklist will most likely look a little different and should be based on your own technical toolkit.
So how do you determine what’s on your checklist? Here are a couple resources to help you get started:
- StockCharts.com Articles
- ChartSchool
- StockCharts TV
- Predefined Scans
- Books
- Your Own Experience
That last resource is perhaps the most important one of all. Remember that your checklist is never truly complete; a mindful investor is always evaluating and improving their toolkit. Always be a student of the markets!
By approaching a chart (or an in-flight emergency) with a systematic checklist, you will ensure that your decisions are based on a rational review of the available information, rather than an emotional response to a potentially stressful situation.
RR#6,
Dave
David Keller, CMT
President, Sierra Alpha Research LLC
Disclaimer: This blog is for educational purposes only and should not be construed as financial advice. The ideas and strategies should never be used without first assessing your own personal and financial situation, or without consulting a financial professional.
The author does not have a position in any mentioned securities at the time of publication. Any opinions expressed herein are solely those of the author and do not in any way represent the views or opinions of any other person or entity.


