 I was once asked the classic “trapped on a desert island” question, with a technical analysis twist: If you could only have one technical indicator (except price), which would it be?
For me, that’s an easy one. RSI.
As part of my training experience at Bloomberg, I was introduced to all the different forms of financial analysis. The moment I saw a price chart, I was hooked. I had studied Psychology at Ohio State, so a toolkit that allowed me to quantify investor behavior just felt right to me.
Of all the technical indicators that I learned about, the Relative Strength Index seemed to be the best way to identify extremes in investor sentiment.
Why does RSI work? In my opinion, technical indicators work because they quantify investor decisions usually driven by behavioral biases. Herding is the phenomenon where investors pile into one side of the trade or the other because they are feeding off of each other’s emotional states. Regarding RSI, we will often see FOMO, or the Fear of Missing Out, manifesting itself in the RSI reaching an overbought or oversold condition.
Beware, though, as an overly simplistic usage of something like RSI can minimize its value. I’ve written about how overbought and oversold conditions are not necessarily good or bad; it all depends on the context.
The current chart of Apple (AAPL) provides a perfect opportunity to break down how RSI can be used to better characterize the price action.
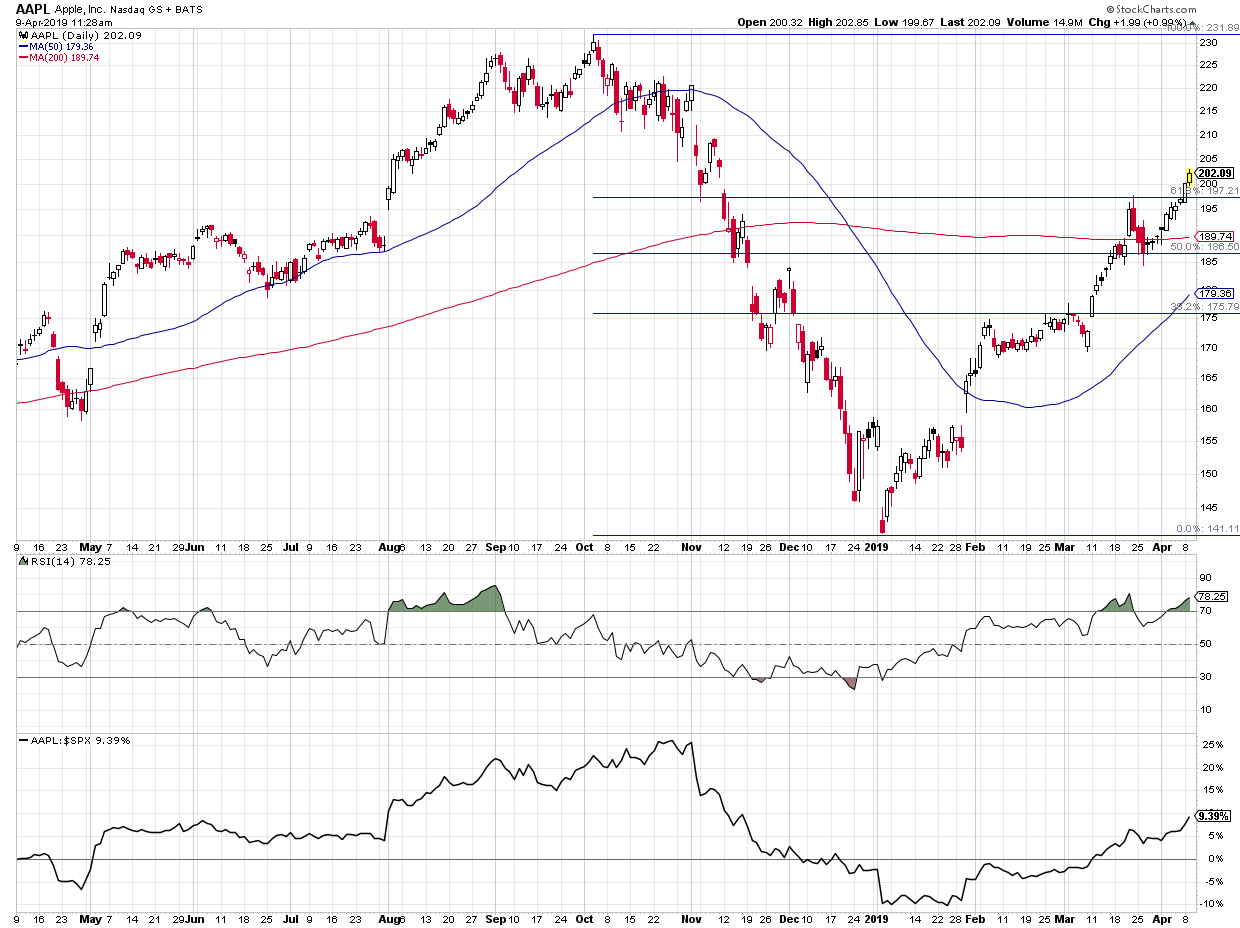
Although the S&P 500 index bottomed in December of last year, AAPL had one more push lower into the new year. Since its January low, Apple has handily outperformed its peers, up over 21% vs. the benchmark.
In mid-March, the RSI became extremely overbought, eclipsing the 80 level. This suggested extreme upside momentum, which usually foreshadows another push higher once the overbought condition is alleviated.
We are now in that second move higher, with the RSI once again approaching the overbought condition. This would suggest a base case of short-term pullback, followed by another push higher. When a stock pulls back after the overbought condition and then pushes one more time to the upside, the momentum is often less significant, which can result in a bearish divergence.
For an illustration of this entire base case, just look back to August 2018 on the chart. AAPL first became extremely overbought in mid-August, resulting in the price pulling back briefly before resuming its uptrend. The next push higher saw an even stronger RSI and the price once again corrected.
Following this, we saw one final move higher. This time, the RSI didn’t even reach the overbought zone. The momentum had been alleviated, with the bearish divergence confirming potential downside for AAPL.
So are we assuming an exact repeat of last August’s price movements? Not necessarily. But, by analyzing historical price performance, we can at least develop a base case for what to expect. Then it’s just a question of monitoring how the price moves relative to your base case and positioning yourself accordingly.
Overall, I’d expect AAPL to have one more push higher, after which I’ll be looking for a bearish divergence to suggest that the upside momentum has alleviated.
As stock prices are driven by fear and greed, the best tool is one that anticipates when those emotions have pushed prices to extended levels. Using RSI can help you identify emotional extremes and anticipate price reversals.
RR#6,
Dave
![]()
David Keller, CMT
President, Sierra Alpha Research LLC
![]()
Disclaimer: This blog is for educational purposes only and should not be construed as financial advice. The ideas and strategies should never be used without first assessing your own personal and financial situation or without consulting a financial professional.
The author does not have a position in mentioned securities at the time of publication. Any opinions expressed herein are solely those of the author and do not in any way represent the views or opinions of any other person or entity.


