
I've written before about the importance of a good morning coffee routine. These are the charts you review first thing in the morning as a way of enhancing your market awareness.
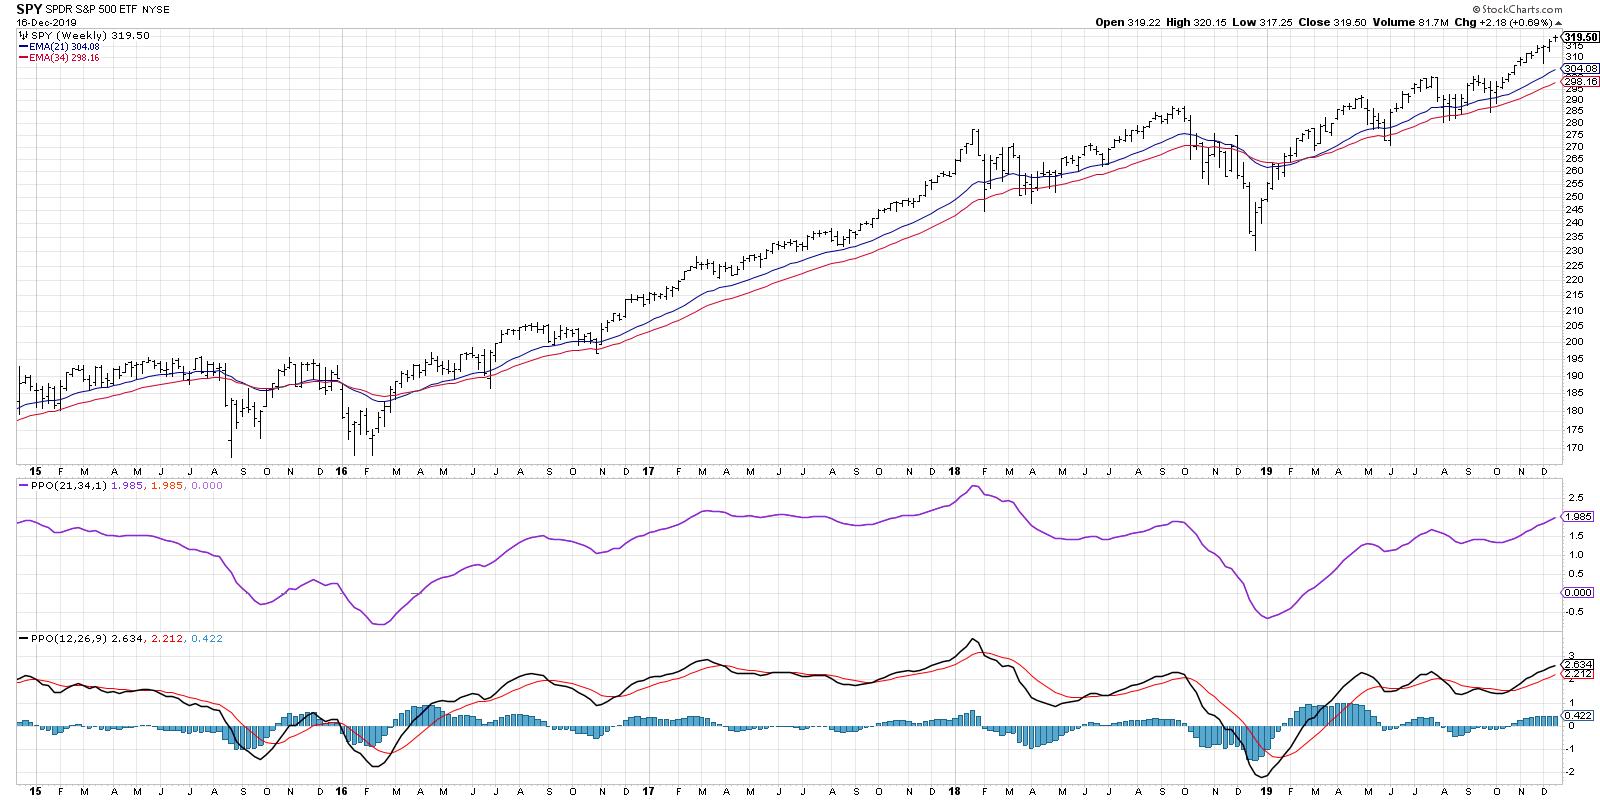
The first chart on your list, given that you're a long-term investor, should be a weekly chart of the S&P 500. That will orient you more to the long-term trend picture and less to the short-term market fluctuations.
Some may downplay the importance of the order of the charts in your routine, but I would argue that a proper order is absolutely essential. By starting with the long-term time frame, you are orienting yourself to a proper long-term perspective.
One of the worst missteps of novice investors is to make long-term decisions based on short-term data. Myopic loss aversion is a behavioral pattern where investors act in too short-term of a time frame (that's the "myopic" part) because of their anxiety about losing money.
So now that you have properly plugged in your brain to the long-term picture with your first chart, what's the second chart on your list? I would argue that, for 90% of investors, that should be a daily chart of the S&P 500.
The daily chart will tell you how the recent price action relates to the longer-term trend. Is the price near any key support or resistance levels? Where is the price relative to long-term moving averages? Are the averages sloping up or down? Is the pattern of highs and lows the same as you saw on the weekly chart or different? By answering all of these questions, you can begin to understand the short-term supply and demand picture. More importantly, you can see if that agrees with what you saw in the long-term charts.
Let's review a current chart of the S&P 500 and see what we can learn:
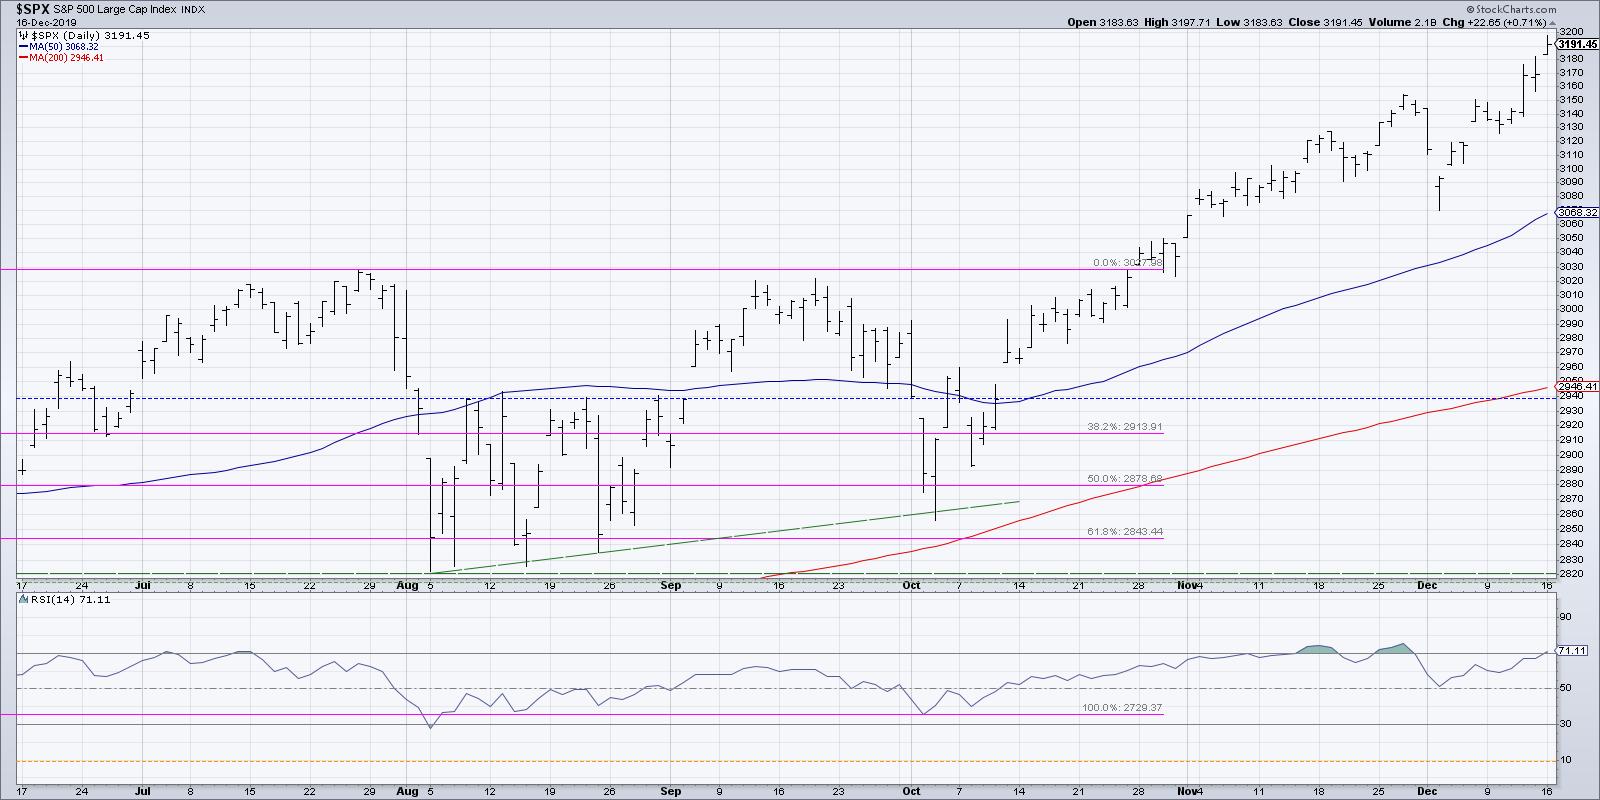
The S&P 500 is displaying a clear pattern of higher highs and higher lows, with recent bars showing three straight trading sessions of all-time high closing prices. The price is above two upward-sloping moving averages; no resistance is in sight because we're pushing to all-time highs.
The RSI is showing a potential bearish divergence, with the recent price high not yet confirmed by a higher peak in the RSI reading. A bearish divergence of lower peaks in RSI with higher peaks in price, if confirmed with a pullback in price during the coming days, would suggest short-term price weakness.
Thus, I can now relate that back to the weekly S&P chart, which confirmed a long-term uptrend as the trend remains overwhelmingly positive.
Conclusion: the long-term trend is bullish, while the short-term trend is also bullish but with a potential trend exhaustion signal based on the RSI bearish divergence.
Now as I continue my daily chart routine, I can relate all subsequent charts back to these crucial first two broad market charts. Everything else is happening within the context of the cyclical bull market, evident from the weekly and daily S&P 500 visuals.
As you begin to refine your own Morning Coffee Routine, I'd encourage you to be thoughtful and deliberate with the order of the charts that you analyze. A proper order will orient you to the proper investment horizon and set up for making good decisions later in the day.
If this discussion of chart routines is of interest to you, I hope you'll join me on Tuesday 12/17 at 11:00am ET for a free webinar event called "Better Routines Mean Better Decisions." I will walk you through my daily and weekly chart routines to demonstrate how you can improve your understanding of asset rotation and identify investment candidates. Here's a link to the Zoom room where the live event will take place. You don't need sign up to attend; just use the link above at 11am ET on December 17th.
David Keller, CMT
Chief Market Strategist
StockCharts.com
David Keller, CMT is Chief Market Strategist at StockCharts.com, where he helps investors minimize behavioral biases through technical analysis. He is also President and Chief Strategist at Sierra Alpha Research LLC, a boutique investment research firm focused on managing risk through market awareness. He is a Past President of the Chartered Market Technician (CMT) Association and most recently served as a Subject Matter Expert for Behavioral Finance. David was formerly a Managing Director of Research at Fidelity Investments in Boston as well as a technical analysis specialist for Bloomberg in New York. You can follow his thinking at MarketMisbehavior.com, where he explores the relationship between behavioral psychology and the financial markets.
Disclaimer: This blog is for educational purposes only and should not be construed as financial advice. The ideas and strategies should never be used without first assessing your own personal and financial situation, or without consulting a financial professional.
The author does not have a position in mentioned securities at the time of publication. Any opinions expressed herein are solely those of the author, and do not in any way represent the views or opinions of any other person or entity.


