
What was the first chart you looked at today? Was it for a stock that you read about in a blog or the newspaper? Was it for a company that was mentioned in that e-mail newsletter you saw? Was it for one of your holdings that you're concerned about?
Whatever the case, the first chart you look at often sets the stage for the entire day. I often find that one's routines are often out of sync with one's goals and objectives.
I've spoken before about your Morning Coffee Routine, that is, the set of tools that you review first thing in the morning as you have a coffee and prepare for the trading day. Here, we'll speak specifically about the very first chart you review.
The question you should have in mind each morning is "What is my overall investment objective and time frame?". The answer to that question should determine the first chart you open in StockCharts.com.
In working with financial advisers and long-term investors, I have seen short-termism creep into the process. That is to say, by focusing too much on short-term news flow and price action, you tend to have too much of a short-term orientation regarding the markets.
If you are a long-term investor, then the first chart you review should look something like this.
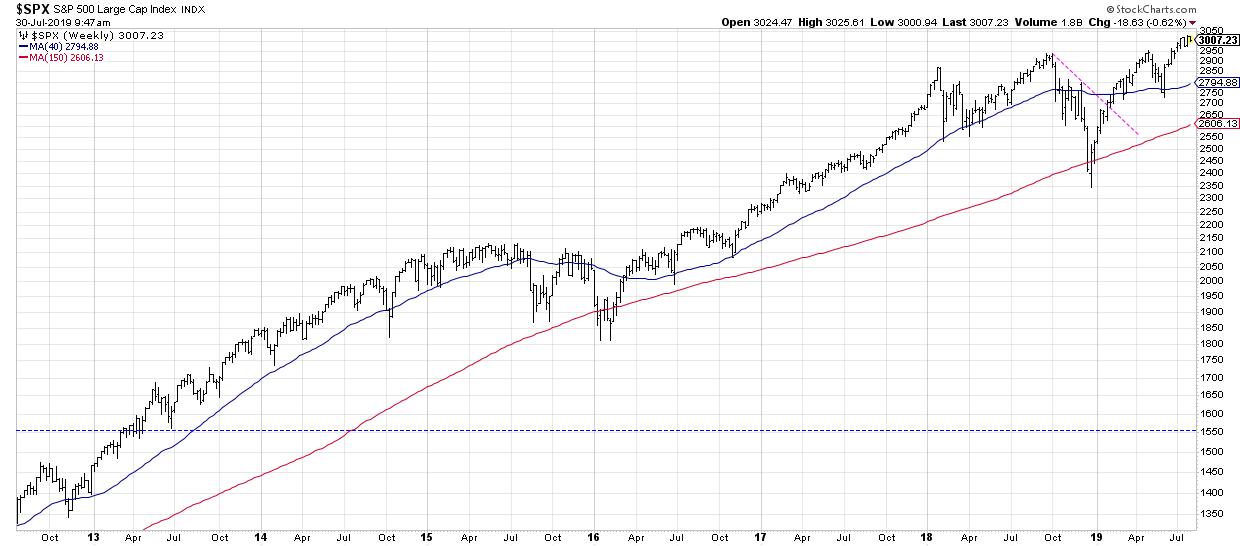
This is the first chart I review every day. It's a seven-year weekly chart of the S&P 500. I'm trying to capture long-term trends and identify inflection points in those trends. That means that I should be reviewing the long-term trend first thing to make sure that's where my head is at. Simple, straightforward and effective.
Regardless of what I'm reading or hearing this morning, I see a long-term uptrend and a market making a consistent pattern of higher highs and higher lows. No matter what I think today will bring, I have to respect the fact that the long-term trend in stocks is bullish. Everything else, all the earnings releases and trade negotiations and Fed decisions, all happen within the framework of that uptrend.
By starting your charting day in line with your investment objectives, you may find it much easier to understand the rest of the trading day in proper context.
RR#6,
Dave
David Keller, CMT
President, Sierra Alpha Research LLC


