My weekly routine involves two important steps. First, in preparation for Friday's edition of The Final Bar, I go through a series of long-term macro charts for my Wrap the Week segment. Second, over the weekend I review the individual stock charts for all the S&P 500 members to identify key patterns, levels and themes.
This weekend's routine sort of focused on a couple areas - the resilience of technology over the long-term, the opportunity in "coronavirus names," such as biotechnology, semiconductors and consumer, and the challenges for sectors like Financials and Energy.
But my most important takeaway this week was a group of three charts that are all facing key resistance levels. I realized that these three charts could be the most important market tell. Either they breakout to the upside and suggest a more rapid recovery than many expect, or they fail in the near future and confirm further downside to this bear market regime.
Here are three surprise charts all on breakdown alert this week.
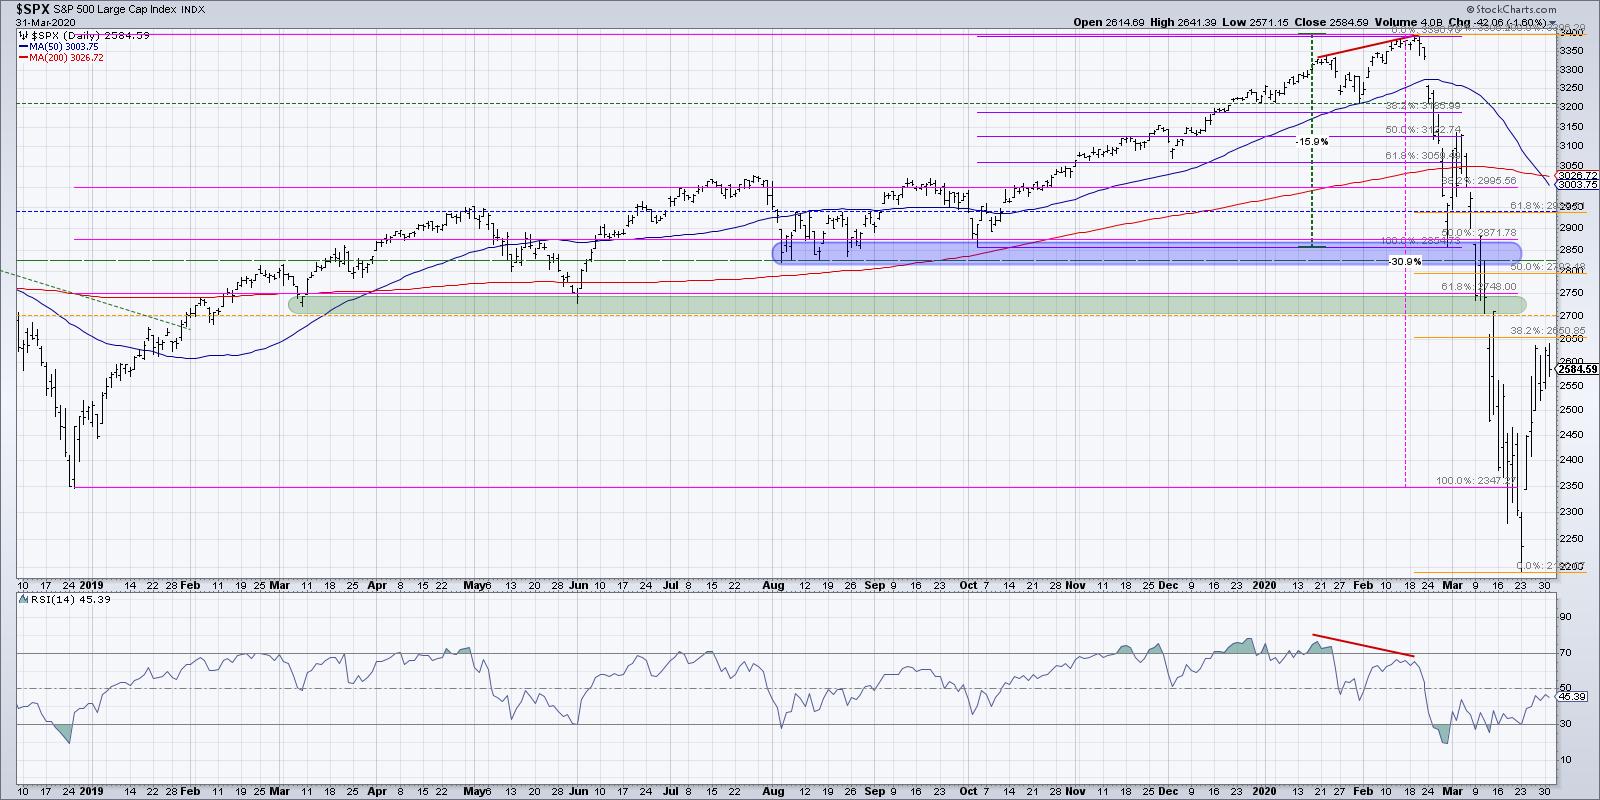
OK, so that's a bit of a stretch to call the S&P chart ($SPX) a "surprise breakdown candidate," but, on Friday, it jumped off the page that we are just below the first Fibonacci resistance area based on the February-to-March selloff. 2650 represents a 38.2% retracement of the bear phase and, just above that, we have 2700, which has been a consistent support level over the last two years.
So, while the first chart is not necessarily a surprise, I do think it serves as a reminder that, while many are speculating on the speed and timing of a market recovery, the market itself is what is most valuable to watch. A confirmed breakout above 2650 would be the first step in building a bullish (or at least a less bearish) market case.
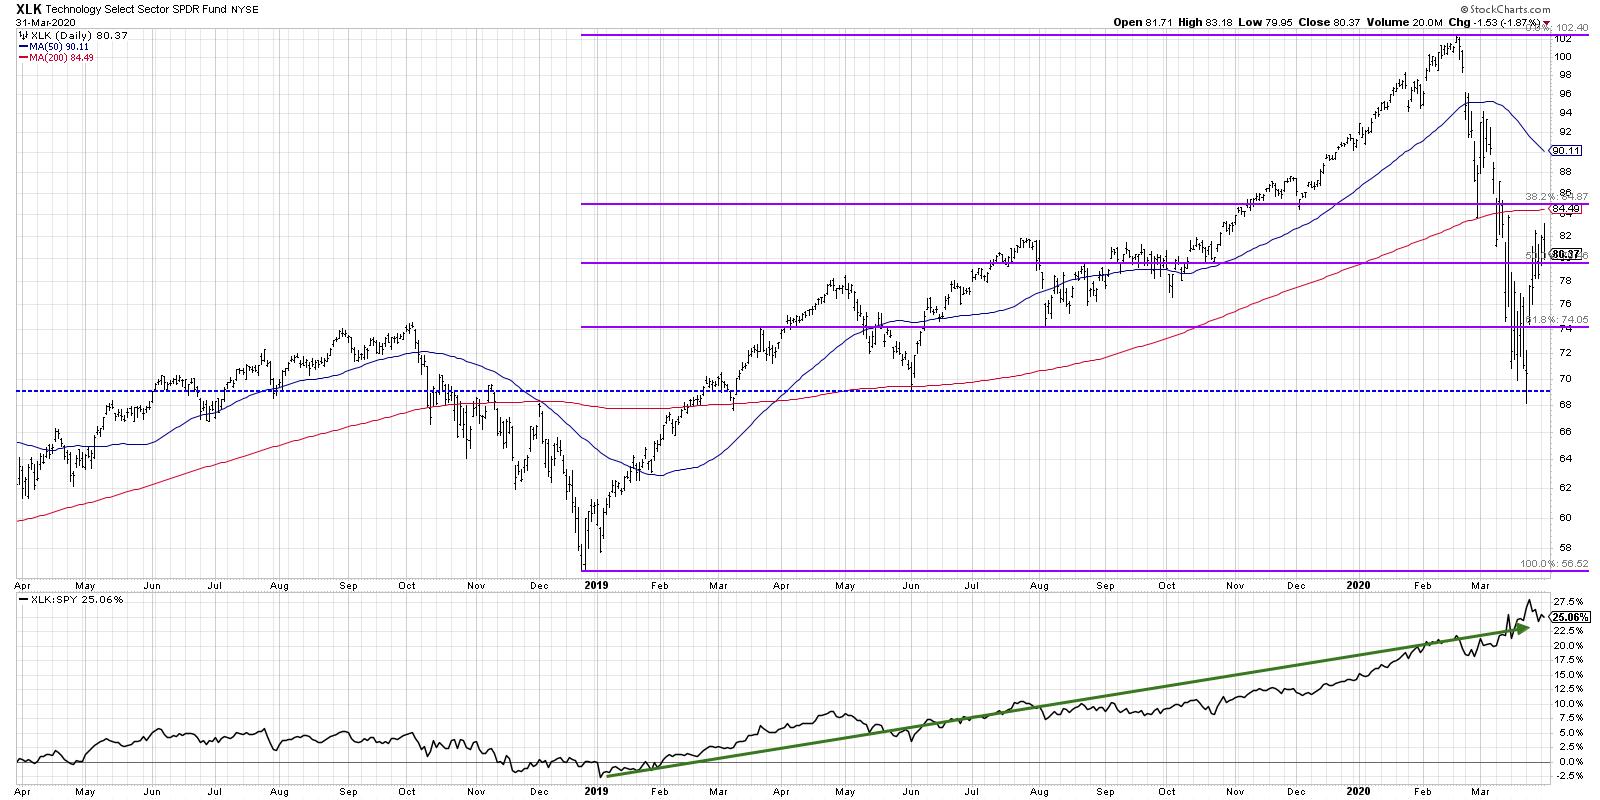
The second chart is the Technology Sector SPDR (XLK), and here we have a confluence of resistance levels. If you look at the 2018-2020 bull phase for technology, you'll see why the $85 level was so important. This was a 38.2% retracement of that rally, which also lined up fairly well with the 200-day moving average.
The last week in February, when the XLK traded below this level and then dramatically closed back above, it seemed as if the market selloff may be sudden but mild. The break of this level in the weeks to come confirmed the dire outlook for stocks.
Now the XLK has returned to the $85 level, but this time from below. The 200-day moving average once again lines up here, and I would expect the tech sector to pull back from this resistance zone. The $74 area would be a logical next move based on Fibonacci support and the price lows from last August. A confirmed break above 85 would indicate the potential for market resilience and, most likely, the continued outperformance of technology.
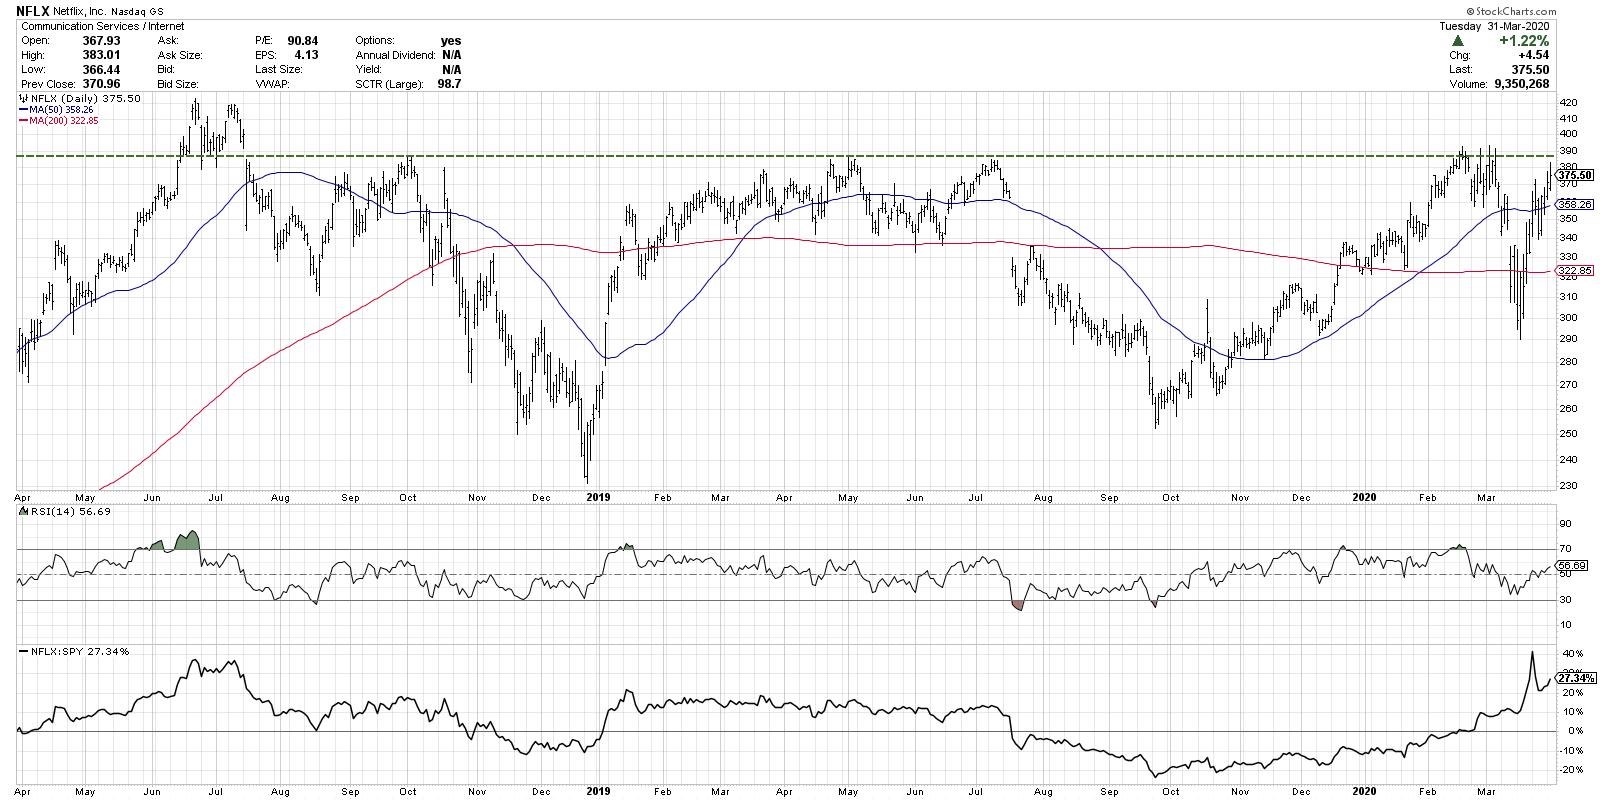
Finally, we have Netflix (NFLX) and what may end up being either the most encouraging or discouraging chart of them all.
When I review the last two years for NFLX, I'm seeing what appears to be a monster basing pattern, with the $390 level serving as resistance many times over. The last eight months appear to be a cup-with-handle pattern, with a long rounding bottom followed by a shallow pullback over the last six weeks.
If Netflix is able to break above this massive resistance to confirm the breakout of this pattern, the traditional measurement approach (using the height of the pattern) would measure up to around $515 as a minimum upside objective. However, if the stock fails once again to eclipse $390, this would leave investors to identify downside support targets, with the 200-day moving average around $325 being the most logical next step.
In any market environment, I like to find a handful of charts to focus on, helping me to summarize the condition of the market using stocks at key levels. These three charts are some of the ones I'll be watching to see if bulls can propel this market higher - or if the bears regain control.
RR#6,
Dave
David Keller, CMT
Chief Market Strategist
StockCharts.com
Disclaimer: This blog is for educational purposes only and should not be construed as financial advice. The ideas and strategies should never be used without first assessing your own personal and financial situation, or without consulting a financial professional.
The author does not have a position in mentioned securities at the time of publication. Any opinions expressed herein are solely those of the author, and do not in any way represent the views or opinions of any other person or entity.


