
For this weekend's ChartWatchers newsletter, I shared some perspective on the bullish divergence appearing on the daily S&P 500 chart. It's worth noting that Monday's selloff pushed the S&P down to new lows, invalidating the bullish divergence.
As price continues lower, new divergences will likely emerge. I feel this article provides a fairly straightforward playbook for how to analyze divergences such as these!
Every Friday on my show The Final Bar, we answer viewer questions from throughout the past week. One of today's questions related to the potential bullish divergence on the S&P 500 using price and RSI. In this article, I'll share how I think about divergences, why it's important to wait for validation and what this means for the short-term picture for stocks.
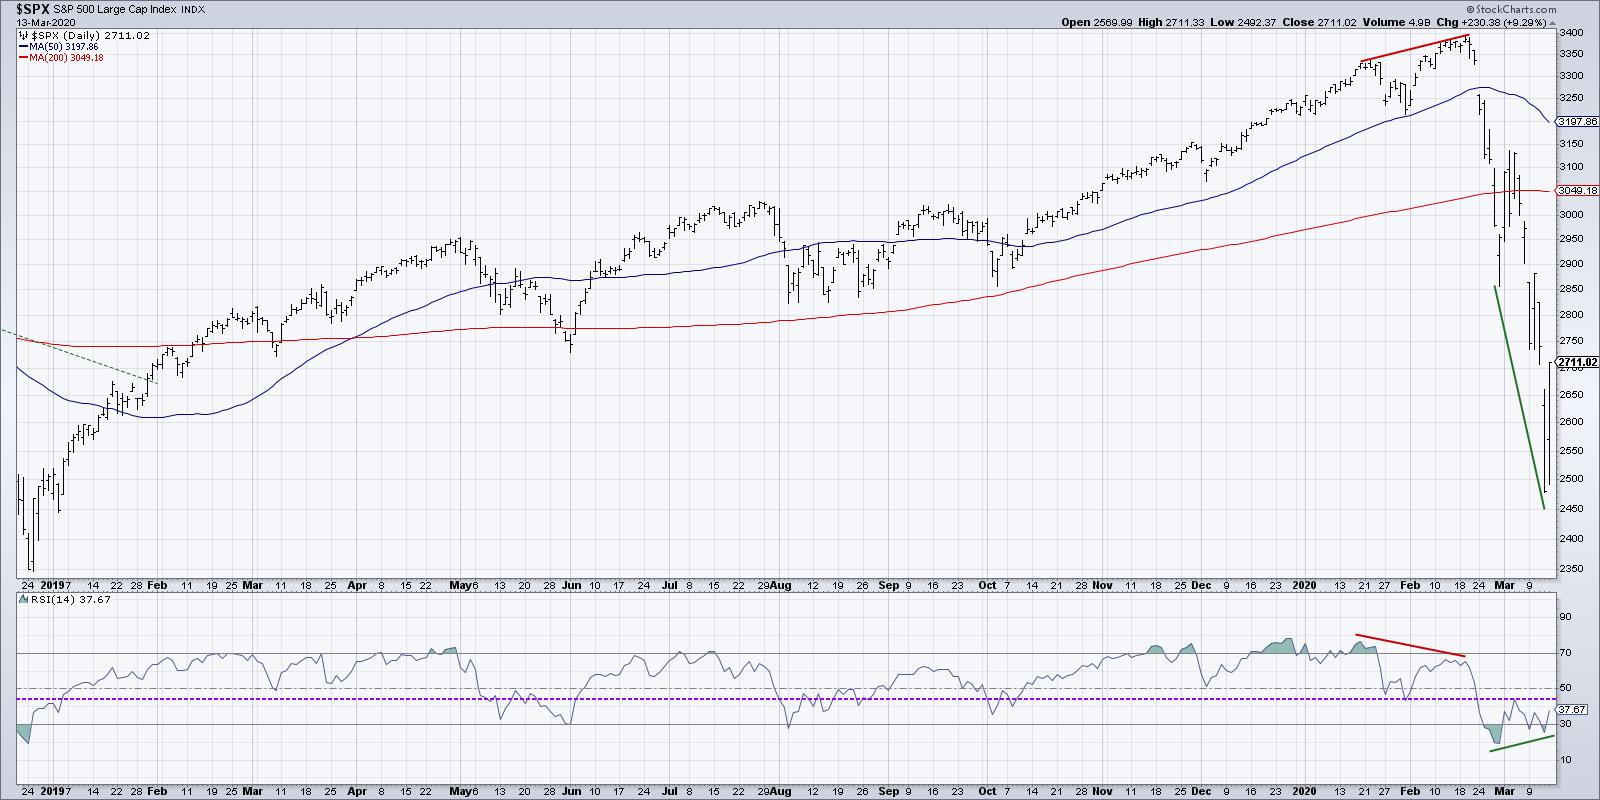
A bullish divergence, by definition, is a situation where you have price going to lower lows and an indicator experiencing higher lows. Here's the current chart of the S&P 500, which provides a fairly straightforward example:

The green lines indicate the bearish divergence, with the price making lower lows over the last six weeks while RSI has put in a higher low. This suggests a lessening of momentum on the downside and usually suggests short-term upside in price.
You'll also note the two red lines that indicate a bearish divergence, with higher highs in price and lower highs in RSI. This bearish divergence, along with weakening breadth characteristics, were a key input in our bearish thesis in mid-February.
But, up until Friday's 9% rally in stocks, was this really a bullish divergence? No!
If you back up the chart one day, you'll notice that the S&P closed Thursday's session near the lows for the day, still appearing to be in a very negative trend.
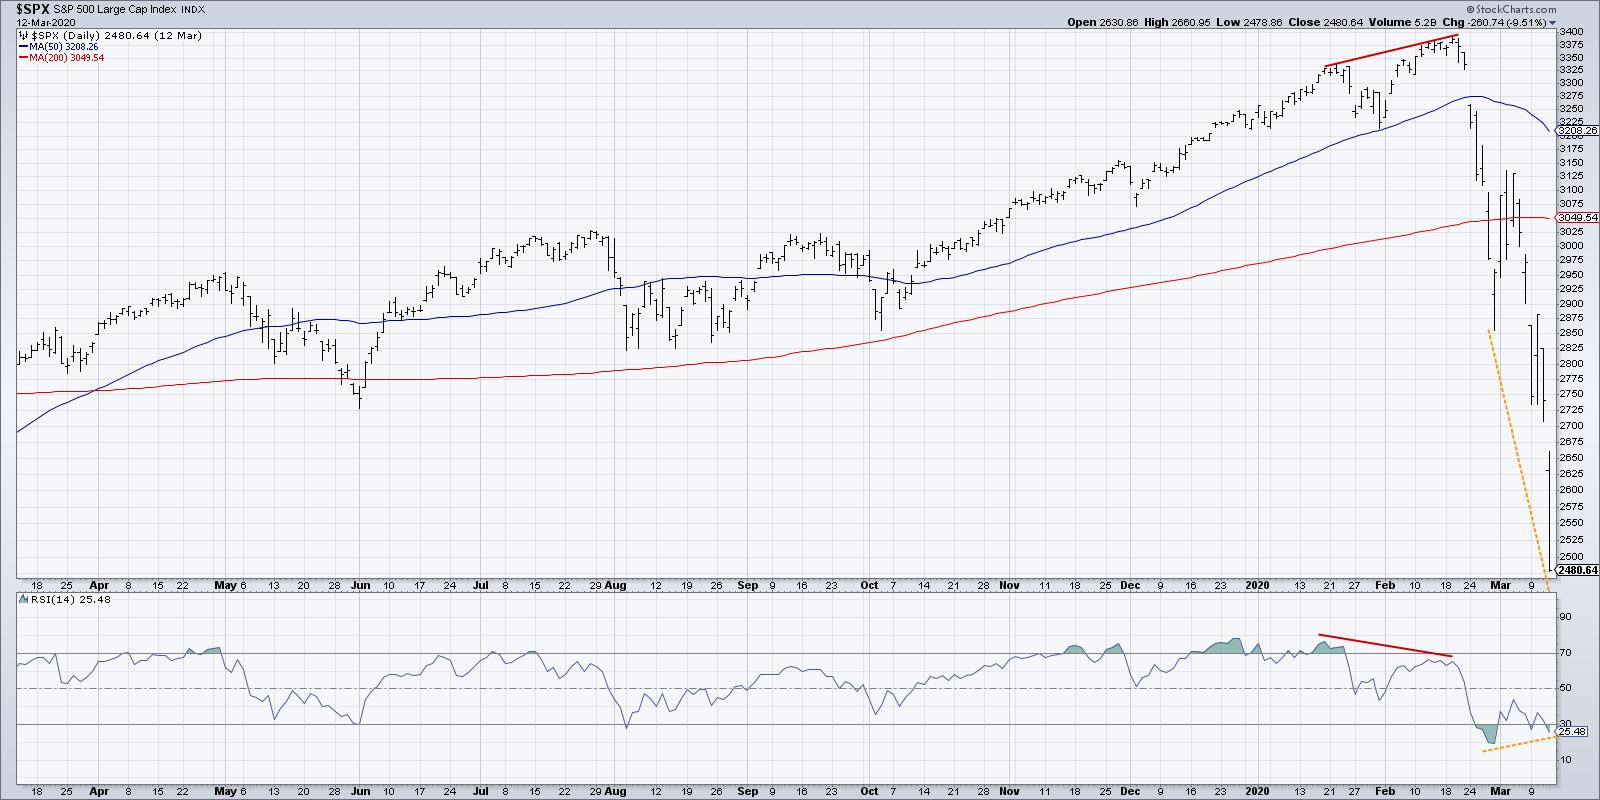
It would be premature to call this a bullish divergence until you have established some short-term price bottom. Otherwise, it's a price still very much in a downtrend.
During the "falling knife" phase of a raging selloff, like we have seen in recent weeks, it's very easy fall victim to a bullish divergence that is not yet fully formed. Now that we've had Friday's rally, which established the 2470 low from Thursday as a swing low for the week, we can now say that the price has confirmed a pattern of lower lows with higher lows in the RSI.
The next step with an RSI divergence is to look for what I call "validation," which is a confirmation that the divergence is indeed playing out as expected.
In this chart, I have indicated the RSI peak from the middle of the divergence as the resistance level. If price rallies enough to push the RSI above this midpoint, I would say the divergence has been validated and the short-term buy signal is in place.
What would invalidate the short-term buy signal? Well, if the price breaks down through the low of the divergence, which is Thursday's low of 2470, then the divergence is invalidated and lower lows would be expected.
So what does all of this mean for the S&P 500 next week and beyond?
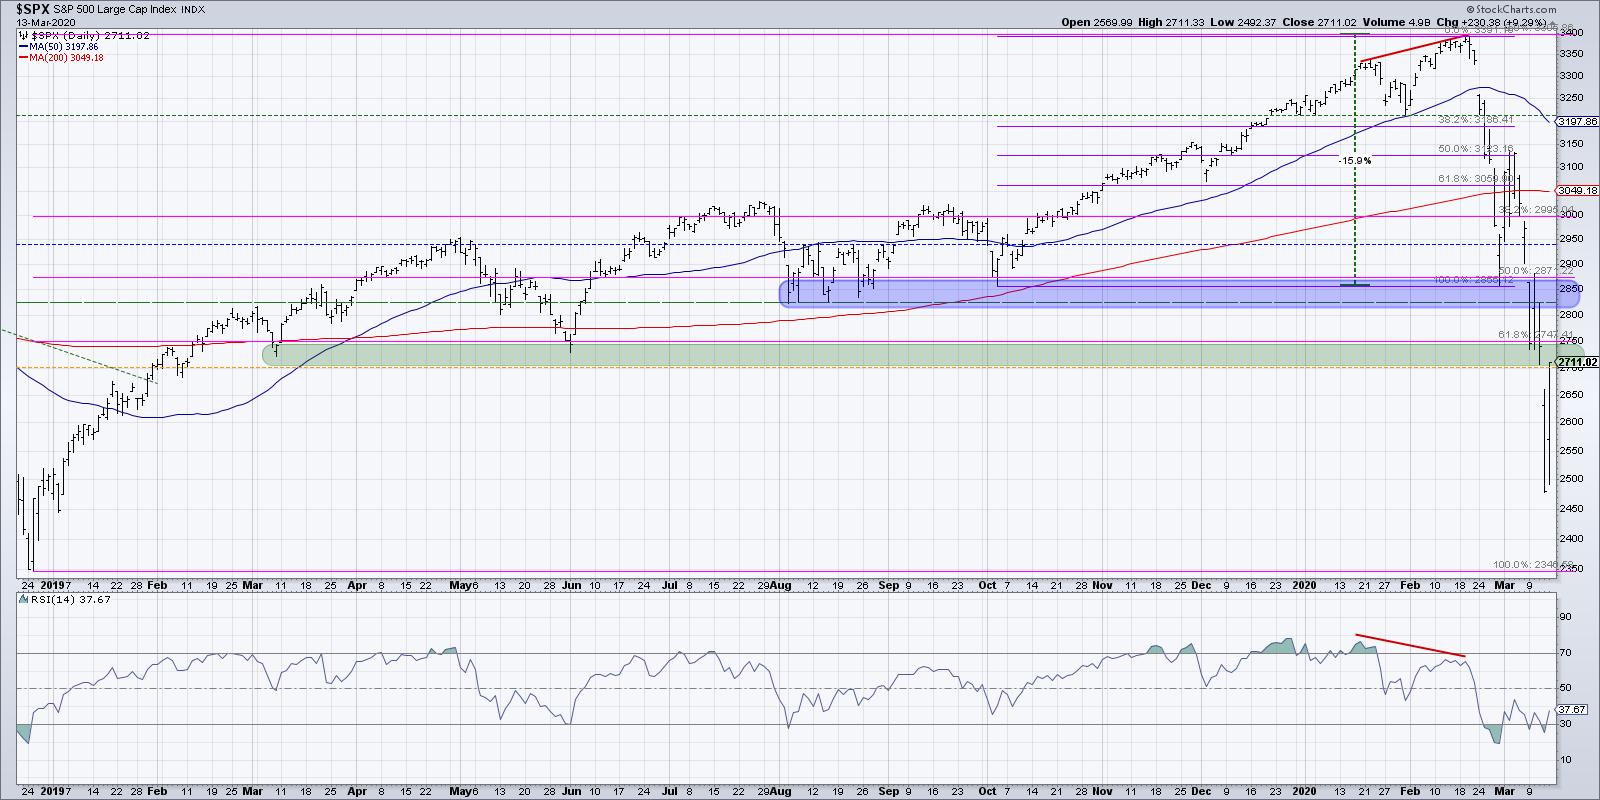
We've now rallied back into the support area in the 2700-2750 range, which was a confluence of levels including Fibonacci support and the price lows from early 2019. I would expect this support range to become resistance, with 2750 serving as the short-term resistance level. But the most important signal will be the next move in the S&P 500 chart.
The next pullback will either a) push down through 2470, invalidating the bullish divergence and suggesting much further lows, or b) set a higher low above the 2470 level, indicating a short-term bottom is in place and we should expect more backing and filling up to 3000.
I have enjoyed many bull and bear market phases over my career. The bull markets have been great, but the bear markets are when I've really been able to grow as an investor.
Next week promises more volatility, more lines in the sand, more macroeconomic and geopolitical events and more opportunities to learn.
RR#6,
Dave
David Keller, CMT
Chief Market Strategist
StockCharts.com
Disclaimer: This blog is for educational purposes only and should not be construed as financial advice. The ideas and strategies should never be used without first assessing your own personal and financial situation or without consulting a financial professional.
The author does not have a position in mentioned securities at the time of publication. Any opinions expressed herein are solely those of the author and do not in any way represent the views or opinions of any other person or entity.


