Every Friday on The Final Bar, I conduct a weekly chart routine called "Wrap the Week" where we review macro charts and how they've evolved over the previous seven days. This week was focused on the unrelenting uptrend in stocks, but a deeper analysis after the close shows that the bond markets are nearing a potential inflection point.
As the S&P 500 index has continued to press on to higher highs and draw ever closer to the February high around 3400, I noted how the daily RSI breaking above the 60 level confirmed that the market was in a bullish phase as opposed to a bearish phase.
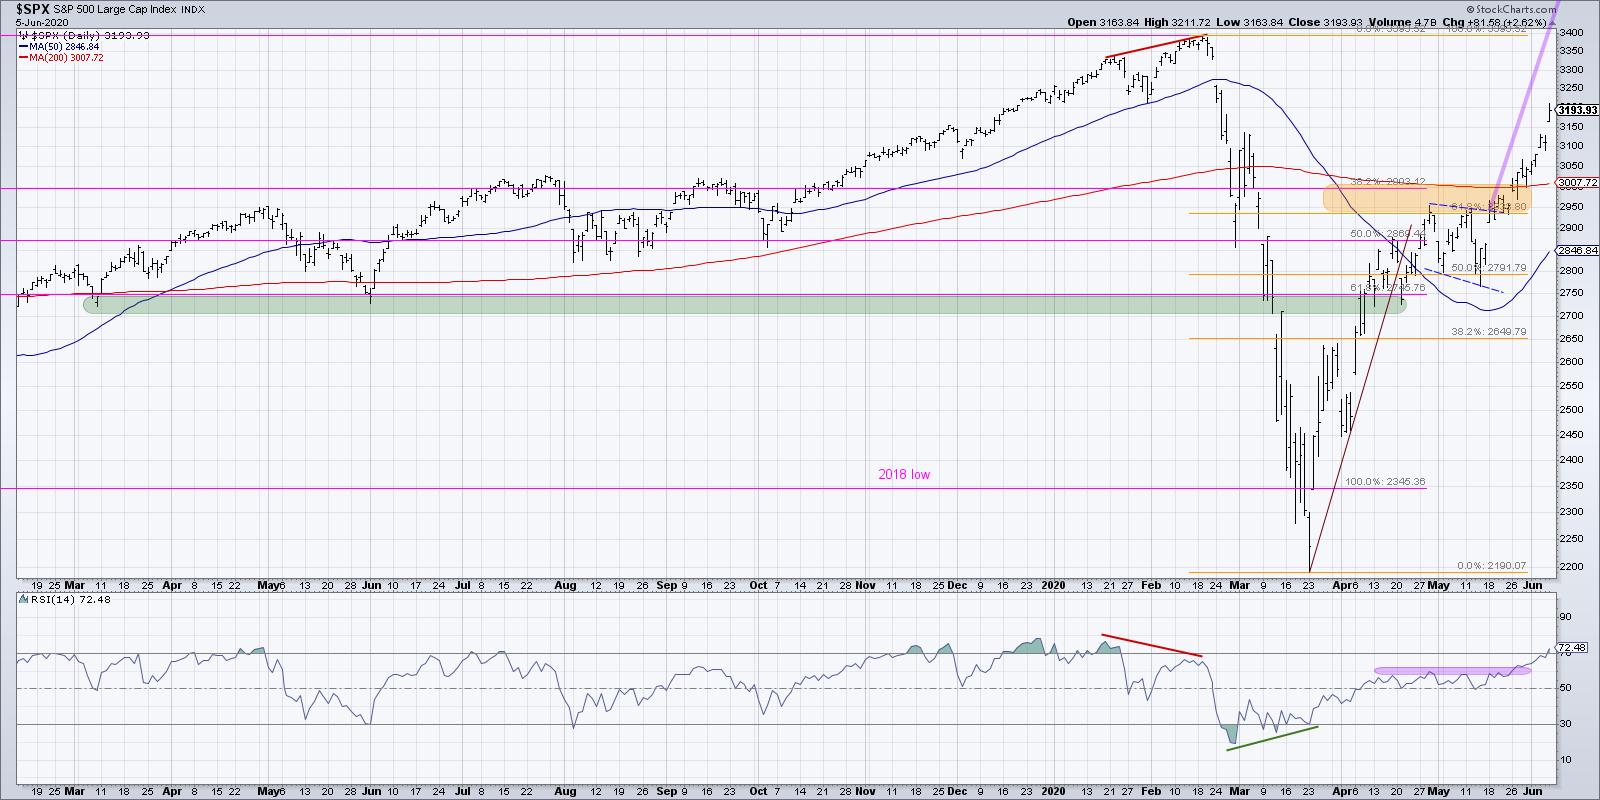
This week has seen the RSI increase to close Friday's session above 72, putting the indicator squarely in the overbought condition. I've written before about the RSI and overbought conditions, particularly about how being overbought is not necessarily a bad thing!
The overbought reading basically indicates that the price has gone up significantly. To put it quite simply, "Overbought means up a lot." In extended bull phases, a chart will often become overbought and remain overbought for way longer than you might expect. The real challenge is when the price comes out of the overbought region and/or completes a bearish divergence, both of which may indicate potential weakness going forward. Neither of these things have happened yet with the S&P 500, which tells me that the trend remains positive and that I should be on the lookout for potential reversal signals.
Even though the bond markets have held up well overall, this strong performance from stocks has driven the stock to bond ratio (using the SPY and TLT) to accelerate to the upside.
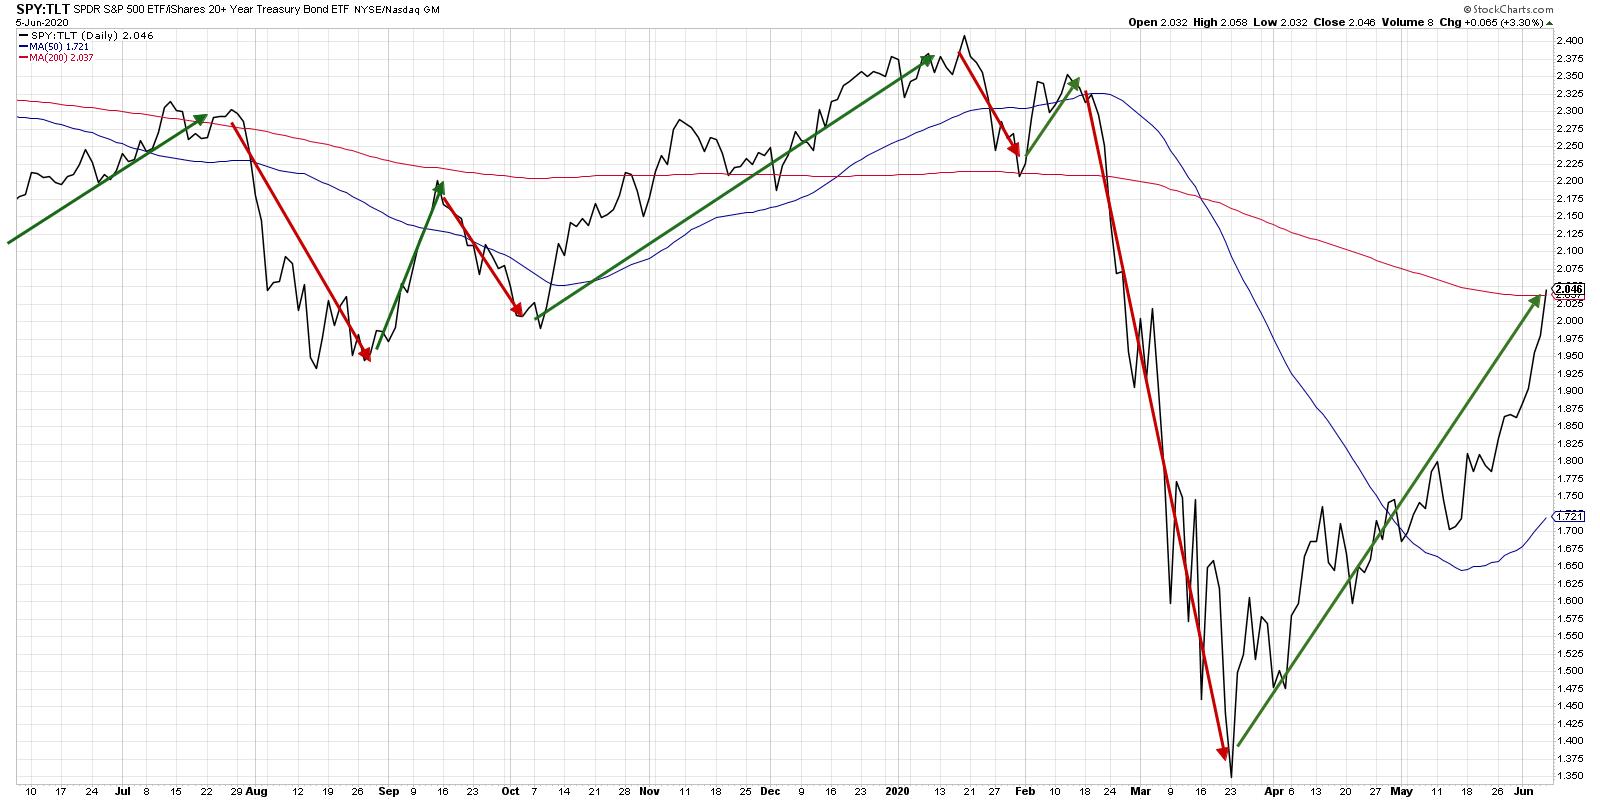
You can see on this chart the dramatic underperformance of stocks in February to March, as bonds rallied during the selloff in the equity markets. From the moment the S&P bottomed out on March 23rd, however, this ratio has pounded out a consistent pattern of higher highs and higher lows.
The chart of the Treasury Bond ETF shows a clear transition from accumulation (Jan-Mar) to consolidation (Mar-May) to distribution (the last two weeks).
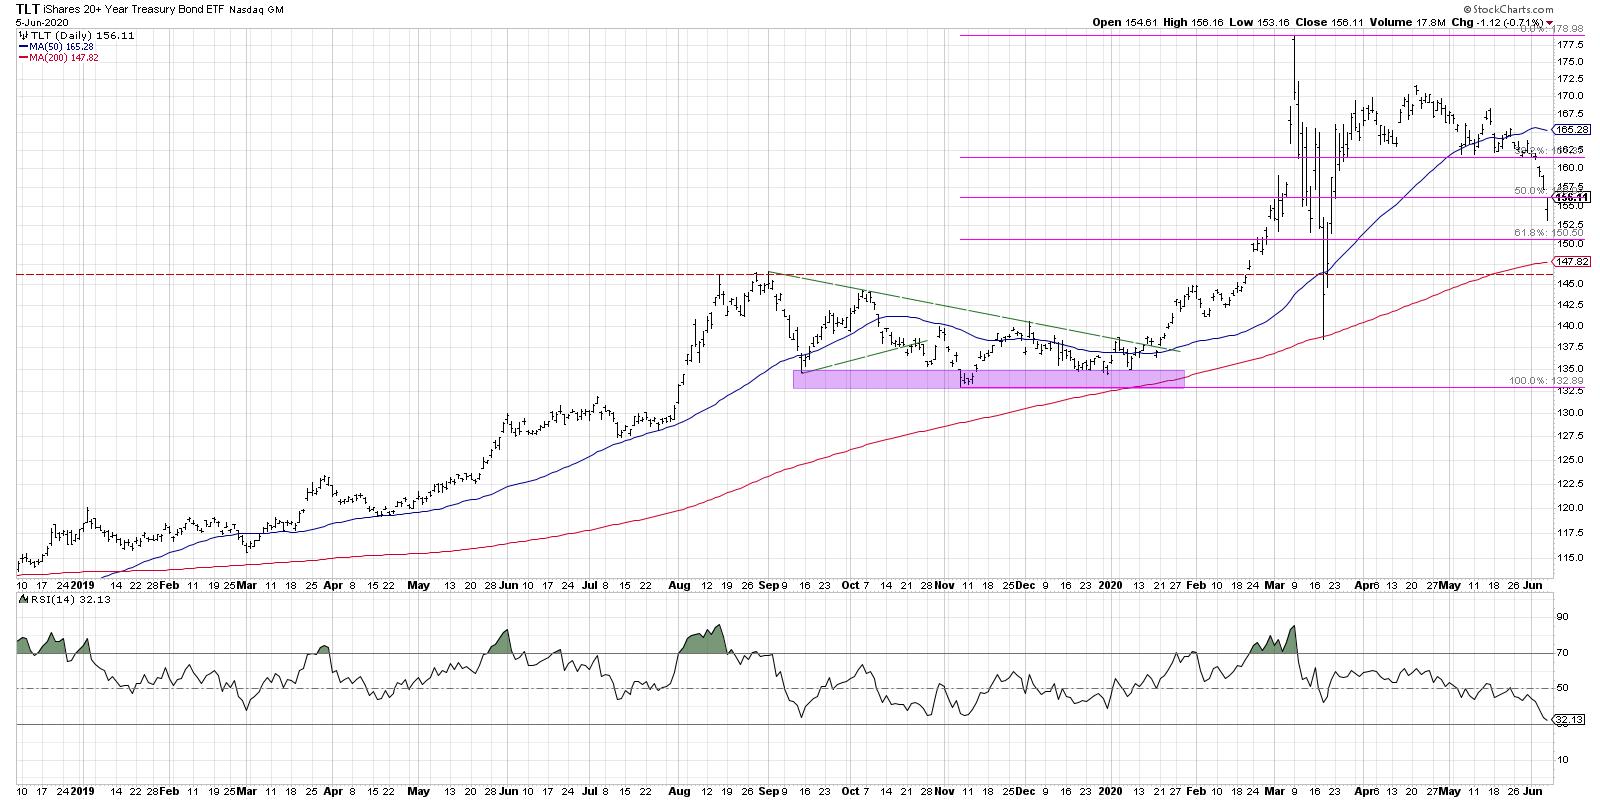
You can see on the TLT chart how the month of March was very much a dislocation, where volatility spiked and there was no clear trend in play. The overall uptrend from the first quarter of 2020 appeared to resume in late March to early April, only to see the TLT settle back to a consistent support level around $162.
This week, we saw stocks rally higher while bonds sold off, driving interest rates higher. Now, we're at a very interesting decision point.
With the S&P 500 now overbought, and the TLT very close to an oversold condition, we are near the point where a mean reversion of some sort is likely. The question, if that would come next week, is whether it is a short-term digestion of equity gains before the resumption of the uptrend OR an early signal of a deeper rotation away from stocks and back into bonds.
Based on the improving breadth characteristics in the equity markets, as well as the pace of the recent selloff in bonds, I would expect any mean reversion to be relatively short-lived. The good news about trend-following is that you don't need to try and predict the future... simply follow the trends!
RR#6,
Dave
David Keller, CMT
Chief Market Strategist
StockCharts.com
Disclaimer: This blog is for educational purposes only and should not be construed as financial advice. The ideas and strategies should never be used without first assessing your own personal and financial situation or without consulting a financial professional.
The author does not have a position in mentioned securities at the time of publication. Any opinions expressed herein are solely those of the author and do not in any way represent the views or opinions of any other person or entity.


