 The end of the year tends to provide the perfect opportunity to reflect, renew and refocus. Hopefully, you've taken advantage of the Reflections 2020 specials on StockCharts TV, including my session on the Ten Questions You Should Ask Yourself at Year End!
I was asked recently by my friend Tom Bowley for my projected path for the S&P 500 in 2021. Let me begin my answer by saying that any sort of projection like this is purely an educated guess (as is much of financial analysis, but that's the subject of another article!).
So why make a projection if it's so unrealistic to do so? For me, investing is all about determining a probabilistic outcome based on my analysis of price trend, market history and investor sentiment.
After making a projection, think through some alternative scenarios. What else could happen? What would the market look like, feel like and perform like given some different projected paths? Finally, I look to position myself for the most probable outcome and determine a plan of action in case any of the alternative scenarios play out.
I learned this way of thinking from aviation. As a student pilot, you're taught to always have an emergency plan in mind. So if your engine cuts out at 6,000 feet, you don't have to try and think through the steps you need to take in the heat of the moment. You've already worked out the procedures, you have a checklist ready to go, and you've already scoped out safe places to land along your anticipated route.
To rephrase, you figure out your exit strategy well before you actually need an exit strategy.
Investors should do the same, which is why developing a projected path makes sense. Here's what I think the market is likely to do over the next twelve months, given my analysis of trend, sentiment and market history.
Late 2020 reminds me of late 2009. Both years saw a severe selloff into a significant low in the first quarter. In both cases, less than 10% of the S&P 500 stocks were above their 200-day moving averages. Then we saw a breadth acceleration where this breadth indicator spiked up to over 90%.
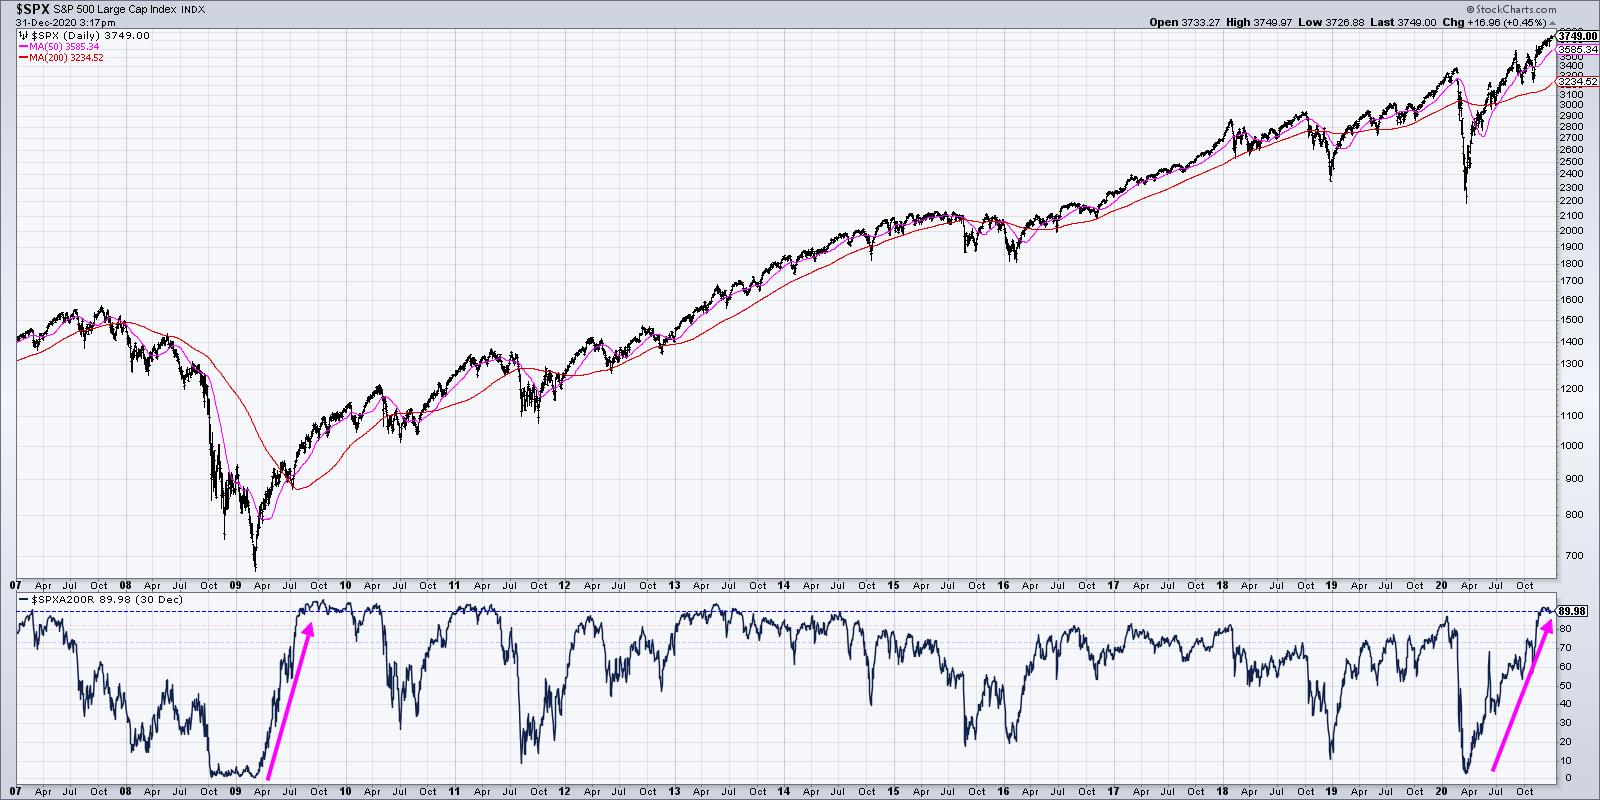
This phenomenon of very negative breadth to very positive breadth is actually quite rare, and only happens after broad advances after significant bottoms.
So what happened after the breadth acceleration in 2009?
2010 saw a selloff in the first quarter, which started soon after the new year began. The market drove to a higher high in the spring before making a new swing low in the mid-summer period. This caused many investors (including myself!) to question whether this was the beginning of a retest of the 2009 lows. The resilient equity markets reversed higher, pausing at the April high around 1200 before pushing even higher into December and beyond.
Given the coronavirus headwinds and challenges in reopening the economy, balanced with the tailwinds of a very accommodative Fed and fear-of-missing-out at arguably euphoric levels, I think the 2010 analogue makes good sense here.
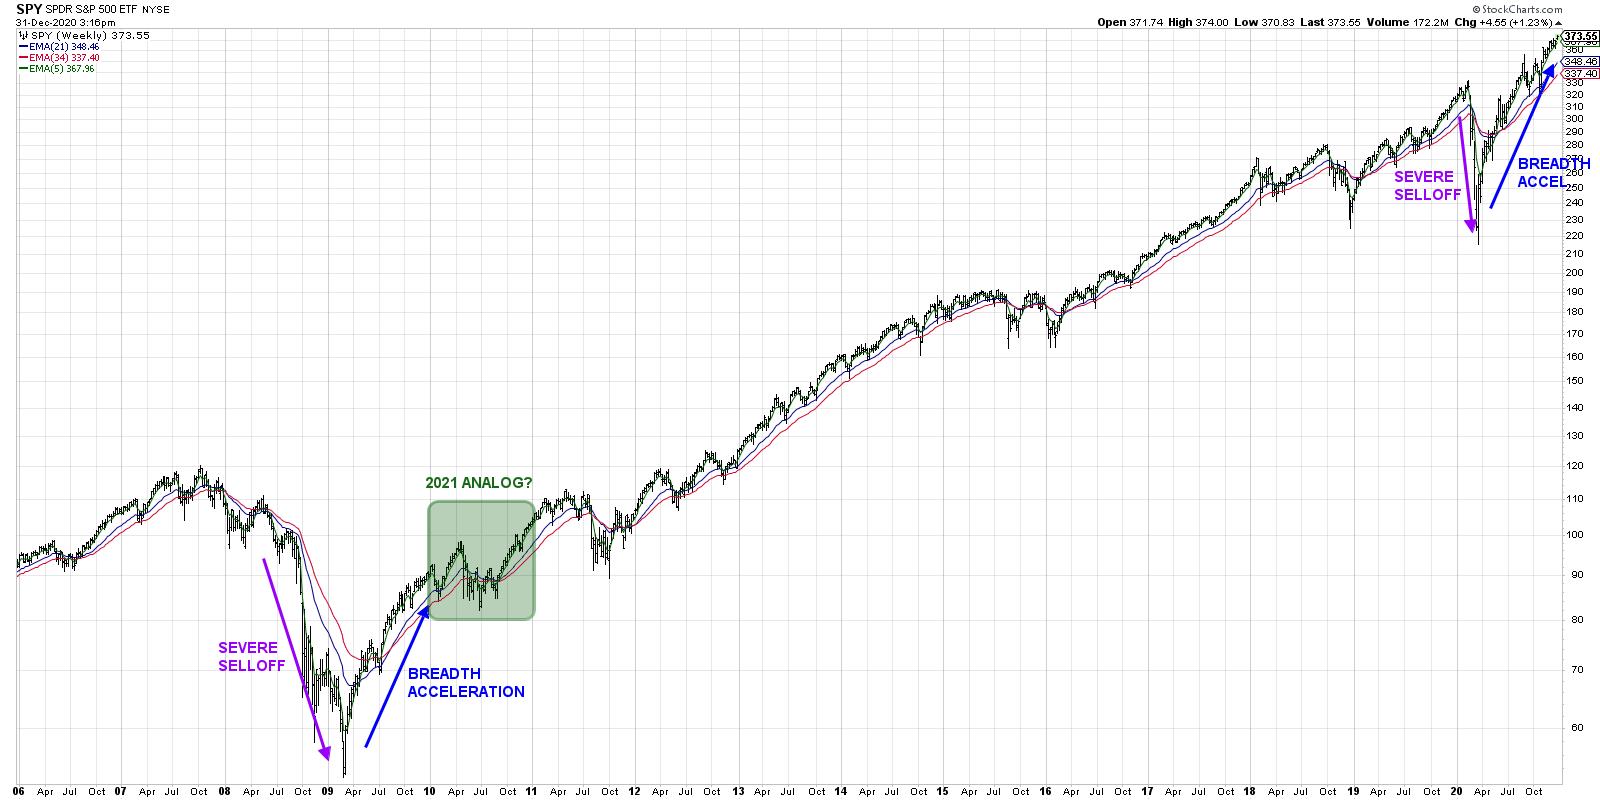
My general assumption is for a range between S&P 3200 and 4200, with the 4200 coming toward the end of the year. I could definitely see a 10%+ pullback in the January/February time frame given the extreme breadth and sentiment readings.
If you're long-term bullish on stocks (which I am), then arguably the best thing to happen would be a meaningful pullback in the first quarter. Such a move to cause everyone to reflect on the progress of this bull market and enjoy the gains that have come thus far. More importantly, this would help the market reset expectations for the significant gains that are yet to come.
So what if my projected path does not play out as expected? That's why I've thought through some other scenarios, thinking about what would cause the market to selloff even more deeply in the new year, or what a continued bull phase would look like. What would the breadth and sentiment charts look like in those scenarios? What key levels should I review for charts like semiconductors, the FAANG names and precious metals that may indicate an alternative scenario is more likely?
I'd encourage you to develop your own projected path. Then, think about some alternative paths the market may take. Most importantly, develop your emergency plan now so that all you need to do is dig out the checklist if things start to move against you.
It's been such a pleasure to share observations and insights with all of you in what has been certainly one of the more challenging years I can remember. Looking forward to many good things in 2021 and beyond!
RR#6,
Dave
David Keller, CMT
Chief Market Strategist
StockCharts.com
Disclaimer: This blog is for educational purposes only and should not be construed as financial advice. The ideas and strategies should never be used without first assessing your own personal and financial situation, or without consulting a financial professional.
The author does not have a position in mentioned securities at the time of publication. Any opinions expressed herein are solely those of the author and do not in any way represent the views or opinions of any other person or entity.


