 Back in early December, we discussed the three signals we would need to see to turn bullish on gold and gold stocks. Although the picture for gold turned more positive that month, a failure at resistance and a return below the 200-day moving average suggest further weakness may be in store for precious metals.
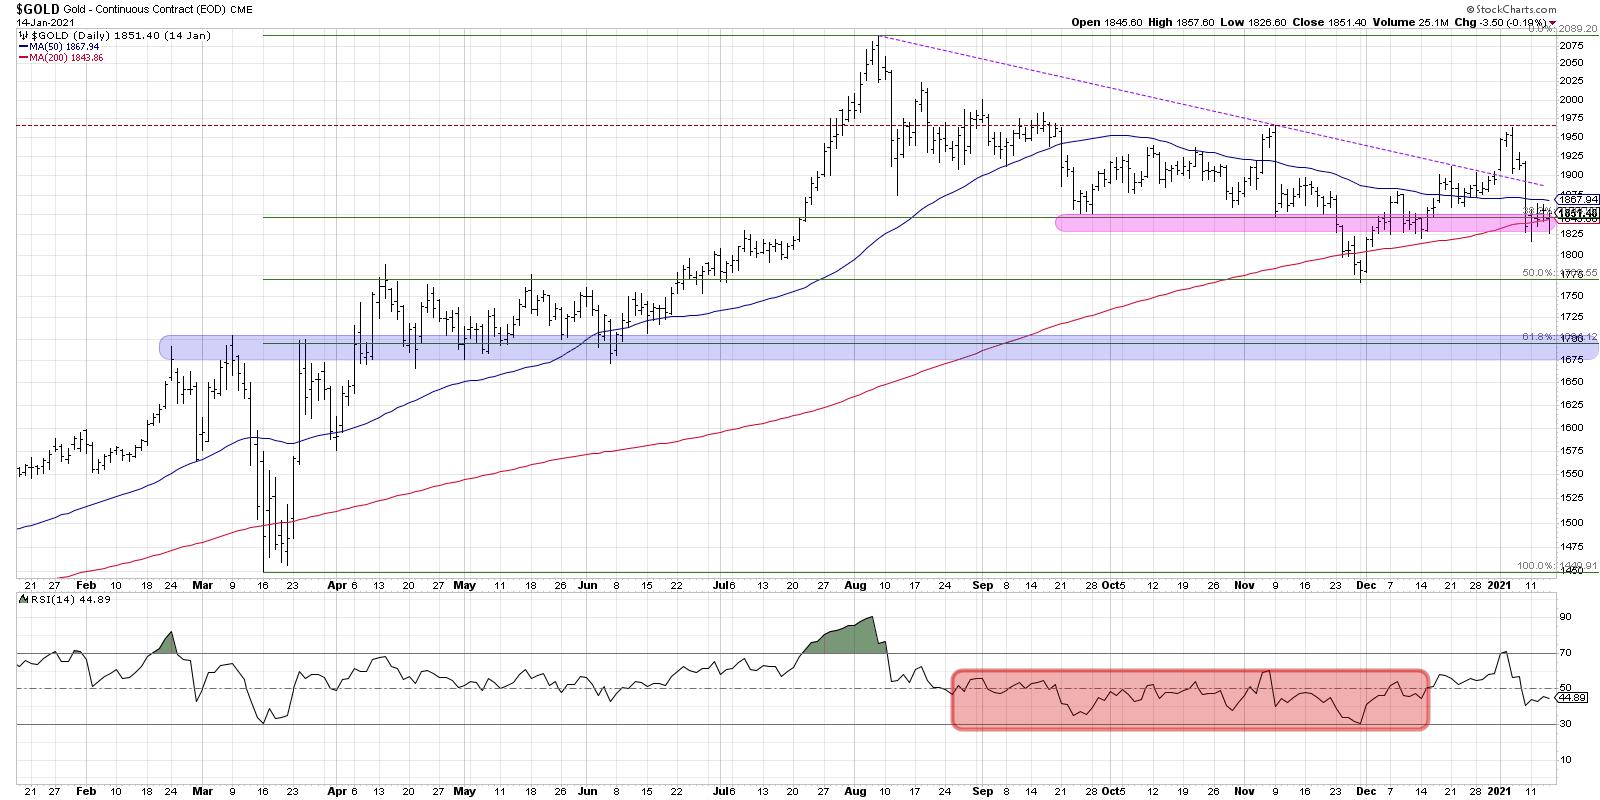
The RSI level on gold may be one of the most important gauges of trend direction. After the August peak, gold pounded out a pattern of lower highs and lower lows while the RSI never reached much above the 60 level on bounces higher. This kept the RSI in a bearish range and confirmed the negative price trend.
The yellow metal rallied soon after our article in December and everything seemed quite bullish, as gold and the GLD broke above trendline resistance using the August and November highs. After the new year, this trendline was broken as gold reached its previous swing high from November.
I discussed gold on Bloomberg TV during the last week of 2020, and later tweeted out that the run was impressive, but that you just needed to see a break to a new swing high to confirm the transition from distribution phase to accumulation phase.
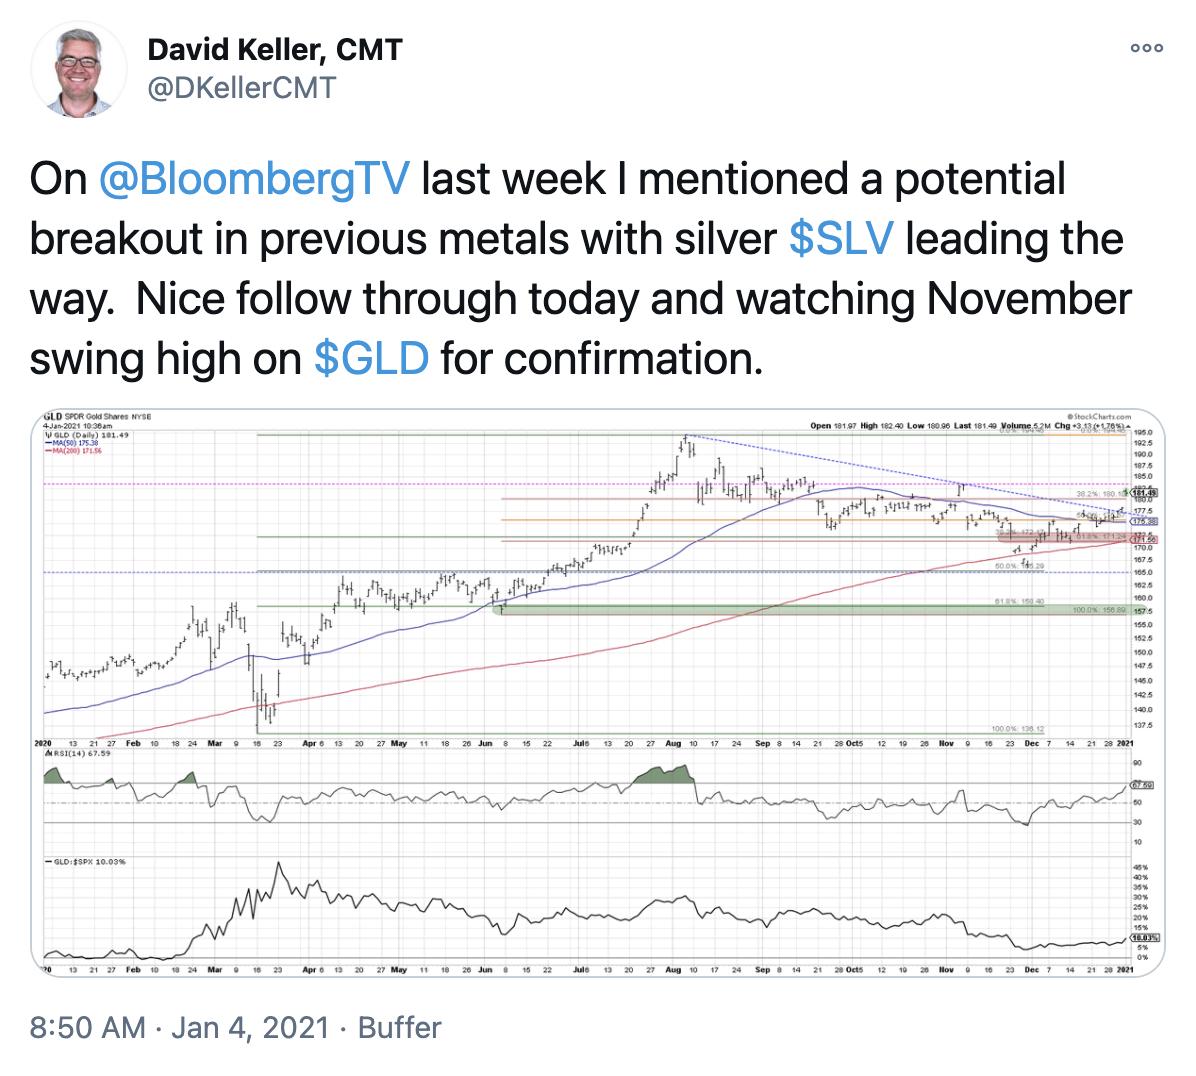
Alas, it was not to be. The November high around 1965 repelled the price advance, and gold has once again reverted back to previous swing lows.
So now we have a bit of a mixed bag of technical evidence to deal with. The RSI remains in a bullish range, with a recent overbought signal and the latest price drop seeing an RSI around 40, which is consistent with bullish phases. Friday's selloff in gold may be enough to push the RSI below 40, however, which would indicate a new bearish phase for precious metals.
The price has pushed back below its 200-day moving average, which, on the surface, is a bearish signal for any trend-follower. This shows that the short-term trend is dipping below its long-term average and indicates more of a bearish posture. However, the last two times gold dipped below its 200-day (November 2020 and March 2020), this phenomenon was short-lived. In both cases, the price quickly reverted back above this smoothing mechanism and resulted in a new swing high.
In a choppy and range-bound chart, support and resistance levels become even more vital. A break lower would suggest potential support at the November low (1770), with ultimate support resting around the 1700 level. That would be a 61.8% retracement of the March to August bull move and would also line up with plenty of support from last spring's lows.
What would suggest that my bearish thesis is incorrect?
First, gold would need to display a similar pattern to 2020, where breaks below the 200-day moving average were short-lived. Second, the RSI would need to remain more in a bullish range, then dip deeper into its bearish range. Most importantly, any bearish thesis would be negated by a break above the key resistance level of 1965. Until then, the path of least resistance appears to be lower.
RR#6,
Dave
David Keller, CMT
Chief Market Strategist
StockCharts.com
Disclaimer: This blog is for educational purposes only and should not be construed as financial advice. The ideas and strategies should never be used without first assessing your own personal and financial situation, or without consulting a financial professional.
The author does hold a position in GLD at the time of publication. Any opinions expressed herein are solely those of the author, and do not in any way represent the views or opinions of any other person or entity.


