I look at hundreds of charts every single day. Every once in a while, I come upon a chart that I feel should be in future textbooks on technical analysis. One chart that seems to provide a perfect example of best practices in price analysis and investor behavior.
This week's review of stocks on the new 13-week high and low lists yielded one such chart: Eli Lilly & Co. (LLY).
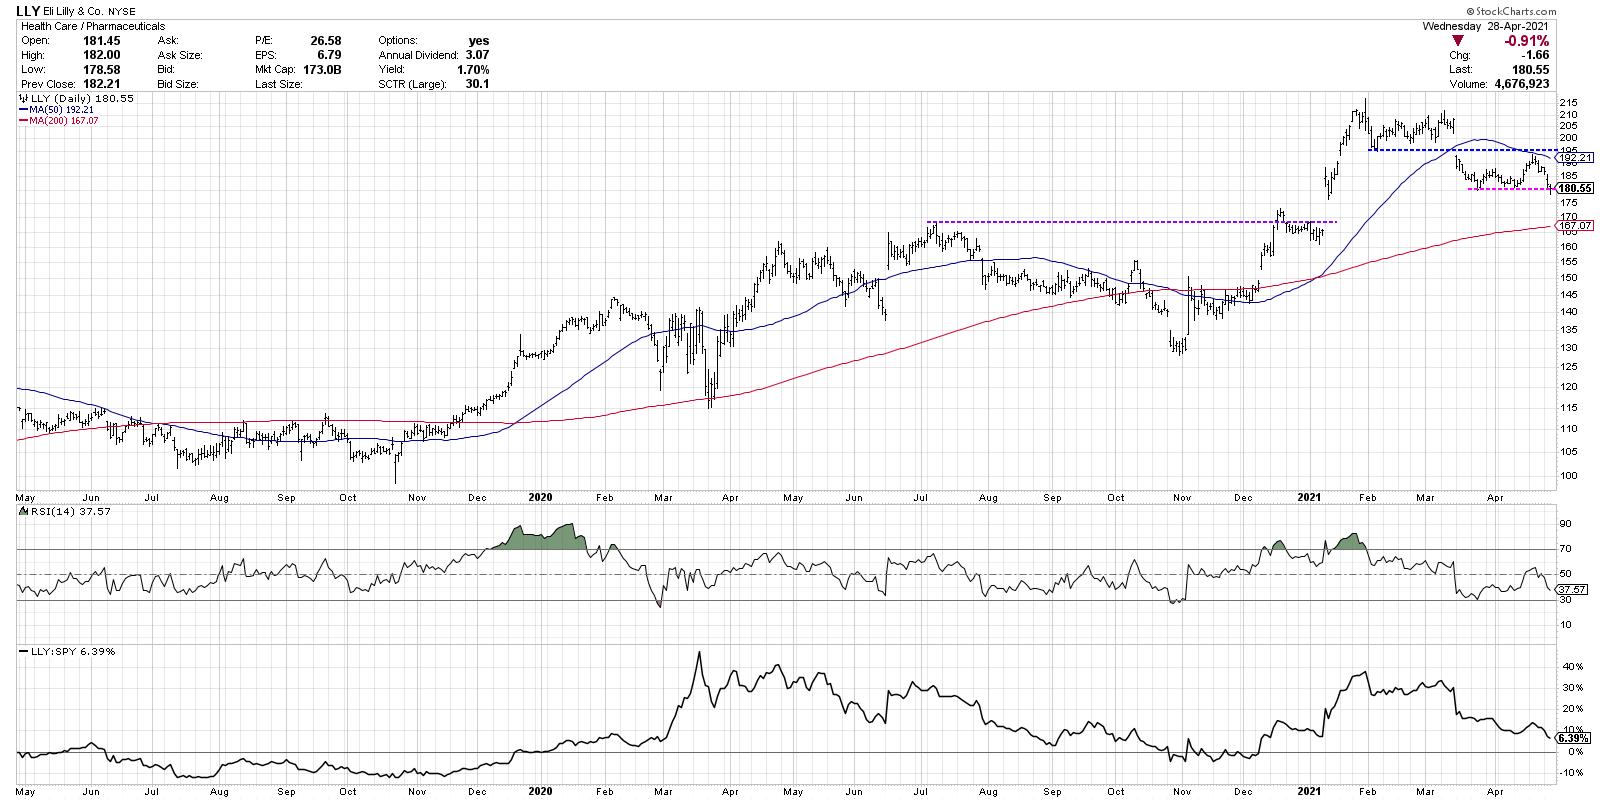
Rewind to January 2021 and you have quite a bullish configuration. The stock gapped higher above price resistance, finally eclipsing the July 2020 high. The stock made a series of new highs as the relative performance (bottom panel) continued to trend higher. This was a solid chart.
Something changed in February, when the price stopped making new highs and settled into a range between 195 and 215. We called this a consolidation phase, which I often refer to as a "digestion period." Imagine that you had a big meal and you need to just relax and spend some time digesting what you just ate. That's LLY in February.
Then, in March, the stock gapped down below price support, moved below its 50-day moving average for the first time in four months and saw its relative strength turn lower. This begins what I would consider the distribution phase, which is where LLY remains to this day. Afterwards, in April, the stock traded back up to price resistance and failed. The stock also tested a declining 50-day moving average from below and pulled back quickly from that level.
Perhaps the most telling indication of distribution is using the RSI (first panel below price). On the most recent upswing in mid-April, the RSI never reached above the key 60 level. In bearish phases, the RSI tends to top out around 60, so the price failing at resistance with the RSI remaining in a bearish range completes this picture of distribution.
This week, the stock is threatening to break its most recent price support yet again, and the relative strength line is making a new three-month low. Could LLY rally from here? Of course. Could it retest the highs and even make a new high next month? Sure.
Tom Dorsey used to relate trends to football. Can you score a touchdown with your defense on the field? Of course. But you're much more likely to do so with your offense holding the ball. Right now, the defense is on the field for LLY as the stock continues to show signs of distribution. Until this chart starts to show some signs of accumulation, the path of least resistance is most likely down.
For deeper dives into market awareness, investor psychology and routines, check out my YouTube channel!
RR#6,
Dave
P.S. Ready to upgrade your investment process? Check out my free course on behavioral investing!
David Keller, CMT
Chief Market Strategist
StockCharts.com
David Keller, CMT is Chief Market Strategist at StockCharts.com, where he helps investors minimize behavioral biases through technical analysis. He is also President and Chief Strategist at Sierra Alpha Research LLC, a boutique investment research firm focused on managing risk through market awareness. He is a Past President of the Chartered Market Technician (CMT) Association and currently serves on the CMT Curriculum and Test Committee. David was formerly a Managing Director of Research at Fidelity Investments in Boston as well as a technical analysis specialist for Bloomberg in New York. You can follow his thinking at MarketMisbehavior.com, where he explores the relationship between behavioral psychology and the financial markets.
Disclaimer: This blog is for educational purposes only and should not be construed as financial advice. The ideas and strategies should never be used without first assessing your own personal and financial situation, or without consulting a financial professional.
The author does not have a position in mentioned securities at the time of publication. Any opinions expressed herein are solely those of the author, and do not in any way represent the views or opinions of any other person or entity.


