As I go through my normal routine of analyzing hundreds of charts every day, or when I'm preparing for my daily closing bell show, I often focus on the "line in the sand" for each chart. That is, what's the point at which you agree you need to exit your position, change your outlook or, at the very least, reevaluate your investment thesis?
You see, it's very easy to become emotionally connected to your investment decisions, which leaves you vulnerable for behavioral biases such as the endowment effect and confirmation bias. But why just focus on one specific price level or indicator? For me, it's all about simplicity. There are always nuances and subtleties and deeper levels of analysis. But, by boiling the chart down to one key level or line or indicator, it's something you can easily track in a spreadsheet or price alert. By simplifying, I can track lots of levels on lots of charts, all at the same time.
My weekly chart routine usually runs Thursday through Monday, and I generally follow the process of macro to micro. I begin with the macro charts in the Mindful Investor Live ChartList, which helps me prepare the Weekly Flight Plan for clients. Then, through the weekend into Monday, I dig deeper into sectors, industries, themes and, finally, with all 500 charts of the S&P 500 members. Whew.
Below, I'll talk about three charts that stood out to me this week, including the lines in the sand for each chart and why these levels are so important. First, let's look at Apple (AAPL), one of the largest benchmark names in the U.S.
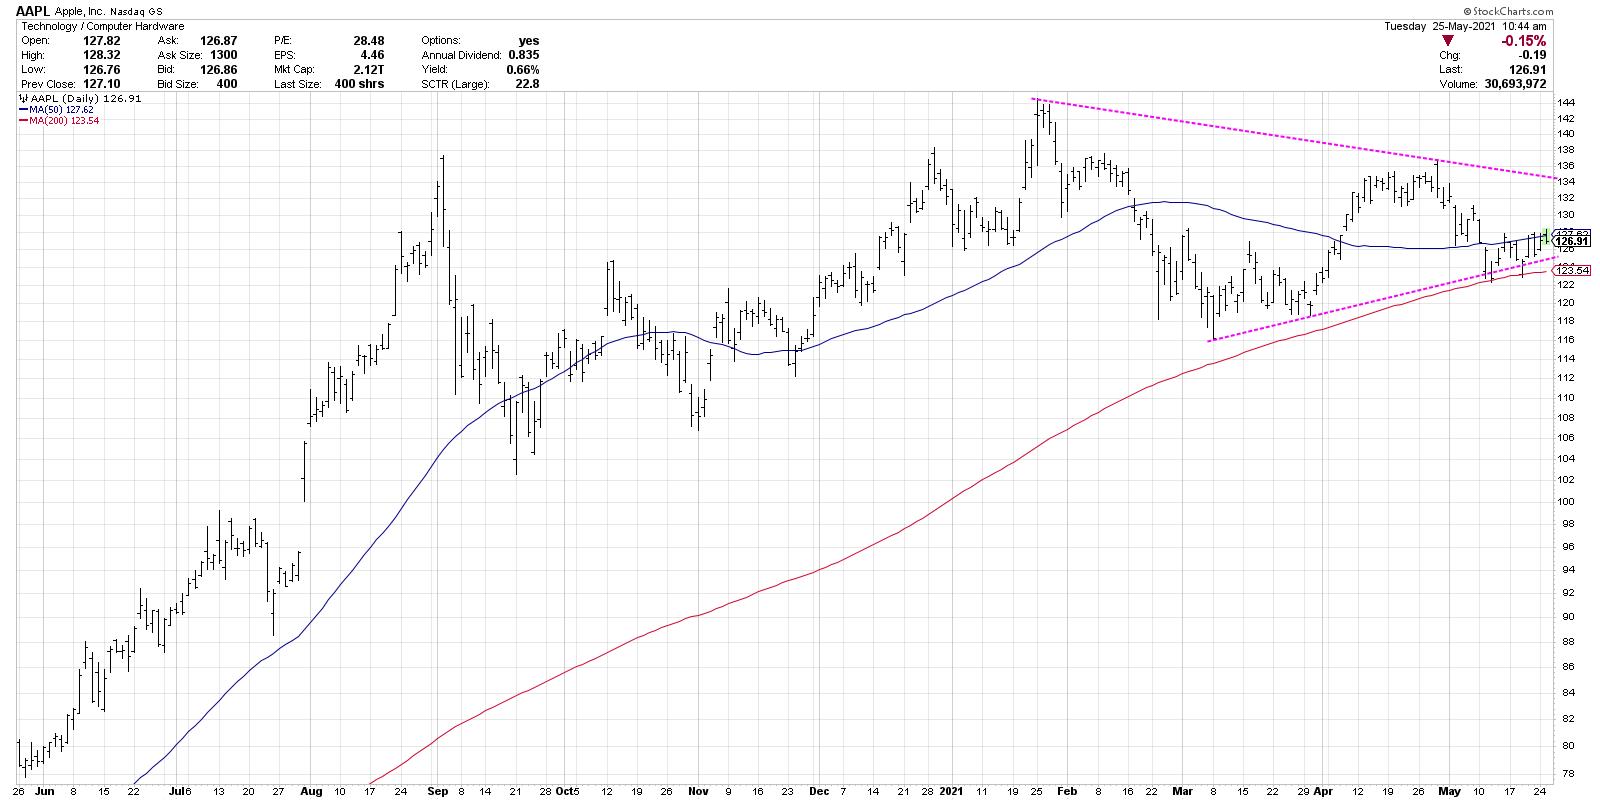
Since February, this chart has settled into a symmetrical triangle or "coil" pattern, with lower highs and higher lows over a four-month period. The good thing about this pattern is that it has to resolve either to the upside or downside before the pattern reaches its natural endpoint.
I would argue this may be the most important chart of all here. A break to the upside would indicate investor optimism, alleviate fears of inflation and suggest a major tailwind for growth stocks. A break to the downside, on the other hand, would indicate the evaporation of euphoric investor sentiment from recent months, and could potentially cause a flood to the exits as market participants realize that support levels are not holding as expected.
Next, let's review the chart of Tesla (TSLA).
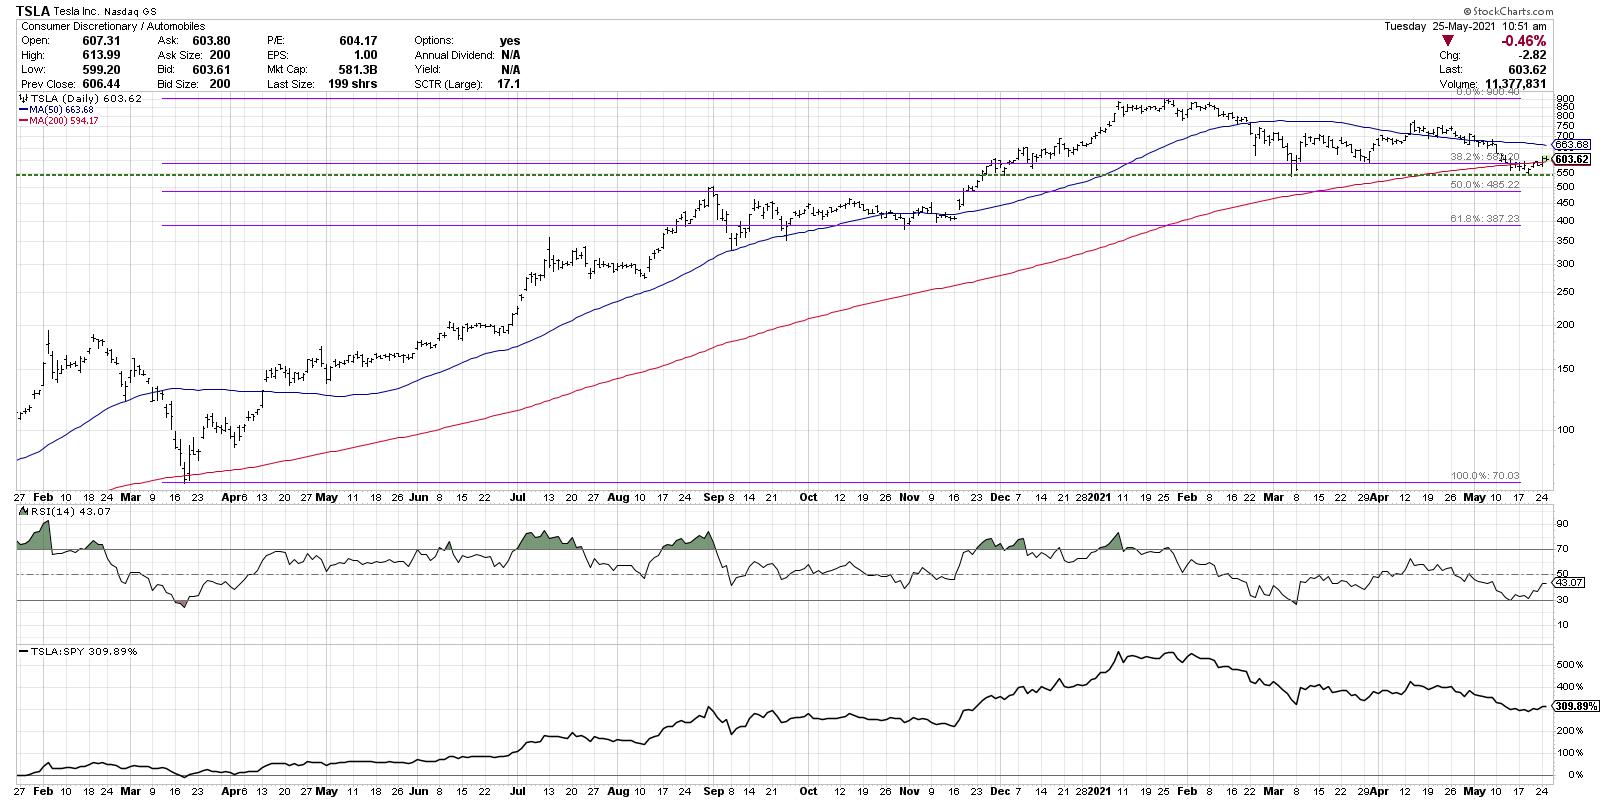
Tesla, in this case, represents a number of stocks in the consumer, technology and communication sectors that have rotated lower. Stocks like TSLA have already established a lower high, and are now testing price support that, if violated, would confirm broad head-and-shoulders top patterns that measure much lower than current levels.
If we take the March 2020 low and connect that to the January 2021 peak for Tesla, we can see that the price is once again testing the 38.2% retracement level. This support level was tested twice in March and represents a clear line in the sand for this chart. A close below $550 would complete the head-and-shoulders top, while also confirming a break below the 200-day moving average. The next downside objective using Fibonacci retracements would be around $400.
If, however, Tesla holds the current support level and rebounds higher, a trendline using the January and April highs may be a good way to confirm upside momentum. A higher low on a subsequent pullback would confirm a more bullish posture for the stock.
Finally, let's look at Facebook (FB), which has clearly the most bullish configurations of these three mega-cap names.
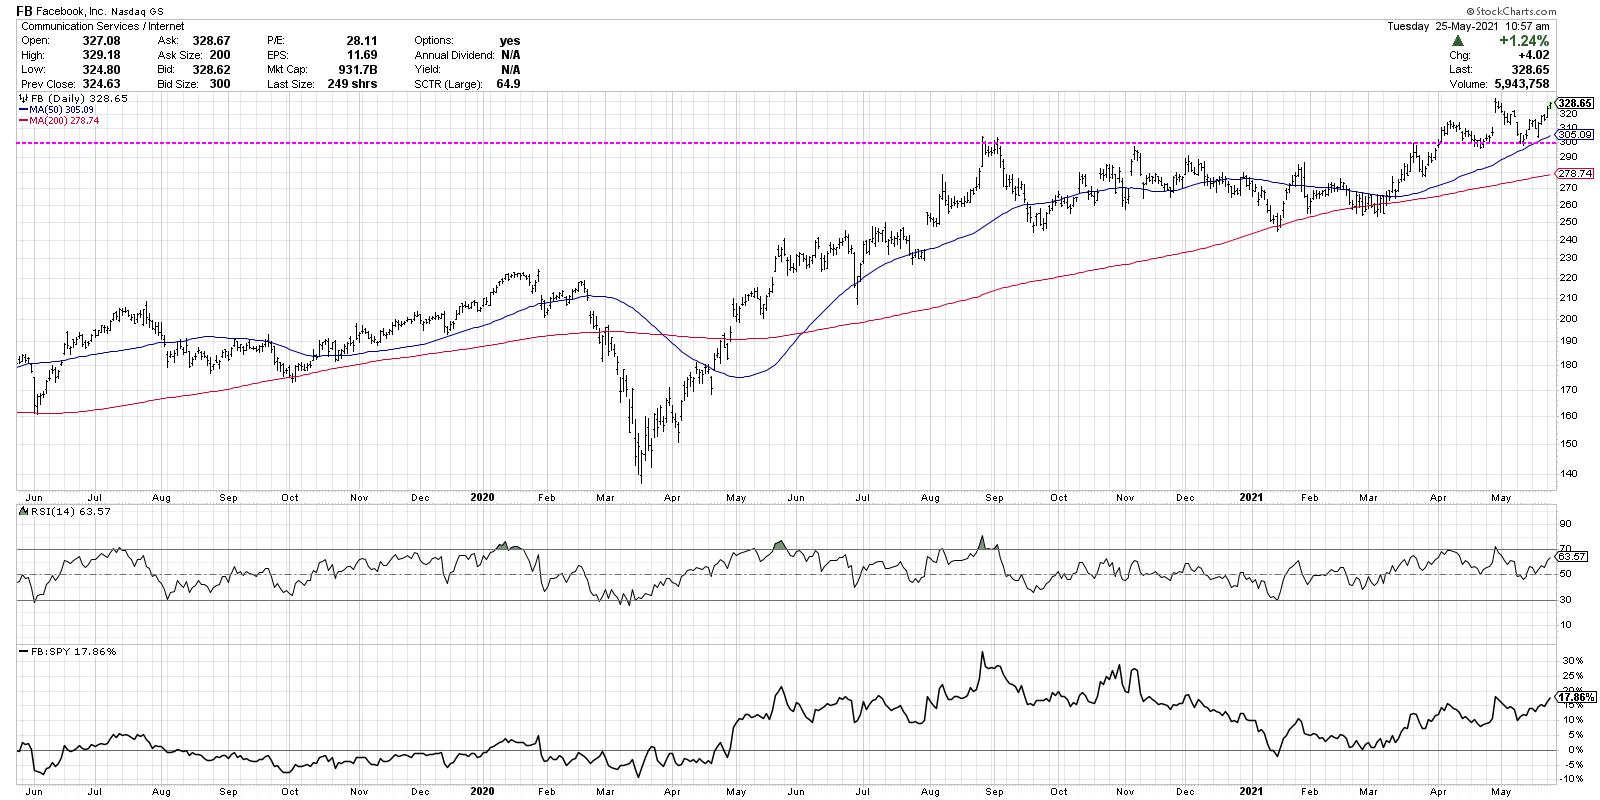
While our first two charts were names in transition, consolidating and testing support, this last chart has already broken above resistance. Facebook first reached the $300 level last August 2020, then tested that same level again in November 2020 and March 2021. In April, the stock broke above this level and then tested $300 from above before rotating higher. This is a classic base with a breakout and retest and indicates high potential for further upside.
At this point, FB is in a clear pattern of higher highs and higher lows, with improving relative strength. As long as this pattern continues, the path of least resistance appears higher from here.
What's the line in the sand that would suggest a reevaluation of that bullish thesis? Quite simply, a break back below support at $300, a level which has clearly become an important price point, would negate the bull case and indicate a more bearish posture, as the uptrend would no longer be in play.
I hope this article helps describe the value of simplicity by focusing on particular price levels to reevaluate your positions, and also gives you three key charts with key levels to watch in the coming weeks!
Want to explore this article in video format? Just click below.
RR#6,
Dave
P.S. Ready to upgrade your investment process? Check out my free course on behavioral investing!
David Keller, CMT
Chief Market Strategist
StockCharts.com
Disclaimer: This blog is for educational purposes only and should not be construed as financial advice. The ideas and strategies should never be used without first assessing your own personal and financial situation, or without consulting a financial professional.
The author does not have a position in mentioned securities at the time of publication. Any opinions expressed herein are solely those of the author, and do not in any way represent the views or opinions of any other person or entity.


