I recently recorded a "Choose Your Own Adventure" style approach to Bitcoin. I laid out four different scenarios for this crypto, from the uber-bullish move to 65,000 to the ultra-bearish scenario down to 24,000.
If you're interested, you can see the original video here and be sure to comment on which scenario you see as most likely and why!
I promised to follow up on that video with my vote and to explain the technical justification and implications for that choice. Given the choice of those four potential outcomes, I would vote for scenario #2. This would mean that Bitcoin remains in a general range between 42,000 on the lower end and 54,000 or so on the upper end.
Here's why.
First, let's start with the general trajectory of Bitcoin over the last twelve months.
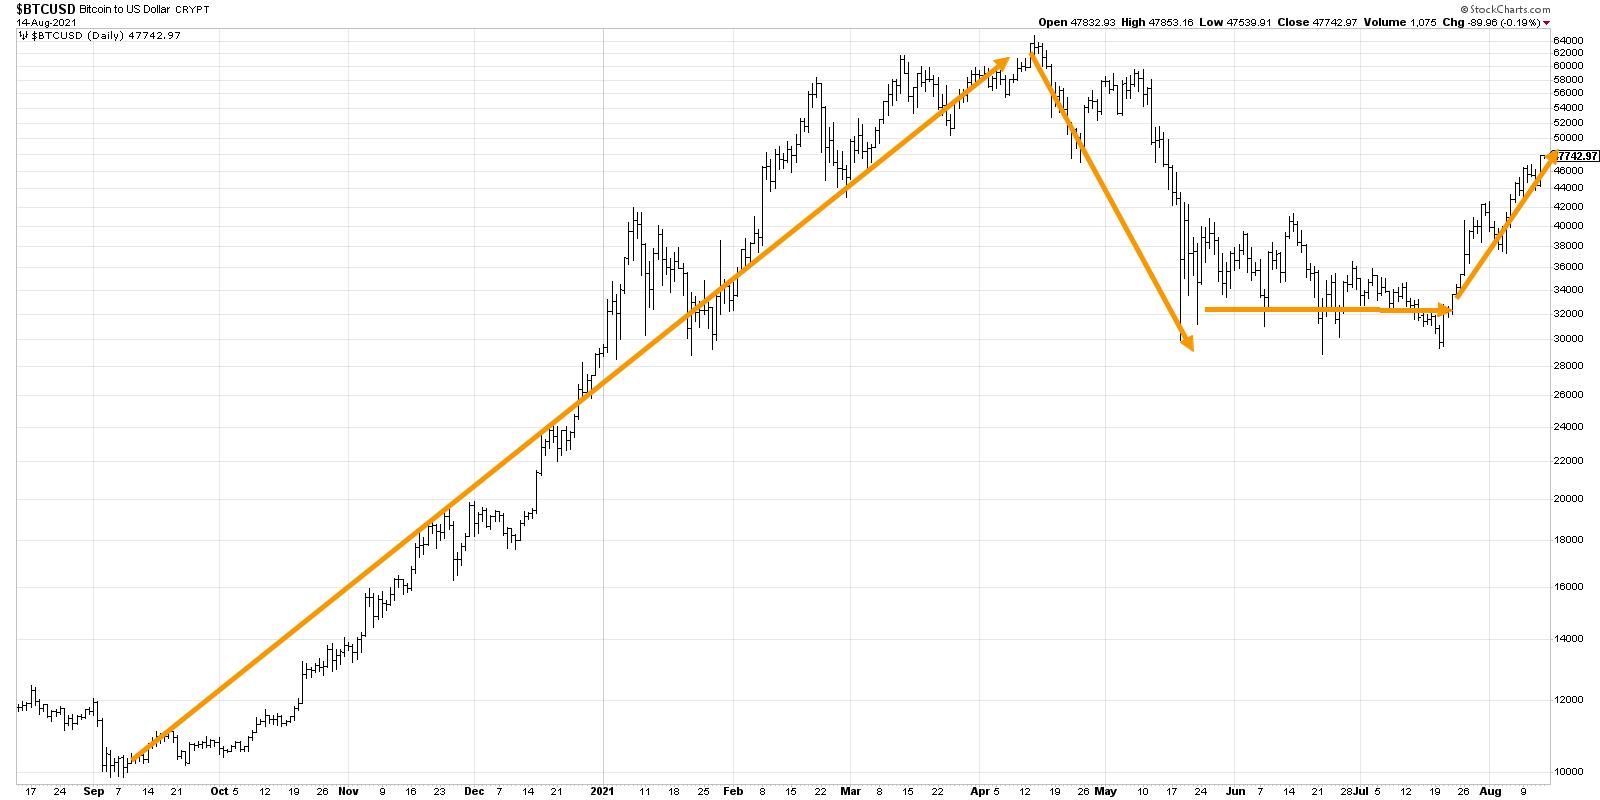
In August 2020, Bitcoin was just turning lower to retest support at the big round number of 10,000. This level served as a springboard as the price launched upward to reach the 42,000 level in January 2021. After a brief pullback to around 30,000, Bitcoin then continued its upward climb to reach its eventual peak just below 65,000.
Notice those two levels, 30,000 and 42,000, as they will come into play again shortly!
Join me on Tuesday, August 17th at 1:00pm ET for a FREE webinar "Relative Strength: Top Performers Make Top Portfolios". We'll discuss how to measure relative strength, ways to visualize relative rotation, and stocks that are demonstrating strong trends now. Sign up here!
After reaching 65,000 in April, we saw an initial move lower to around 48,000, followed by a significant drop to find support at 30,000. This down move, punctuated by a lower high in early May, was an indication that Bitcoin had transitioned from a bullish phase to a bearish phase. This support level of 30,000 remained important through May, June and July as Bitcoin consistently rose from that price point. This period is what I would consider a digestion or consolidation phase, as the crypto remained rangebound with 42,000 serving as the upper boundary.
In the last four weeks, Bitcoin has managed to finally break out of this sideways range, suggesting a transition from consolidation phase to another accumulation phase.
Now let's review the chart with some additional evidence.
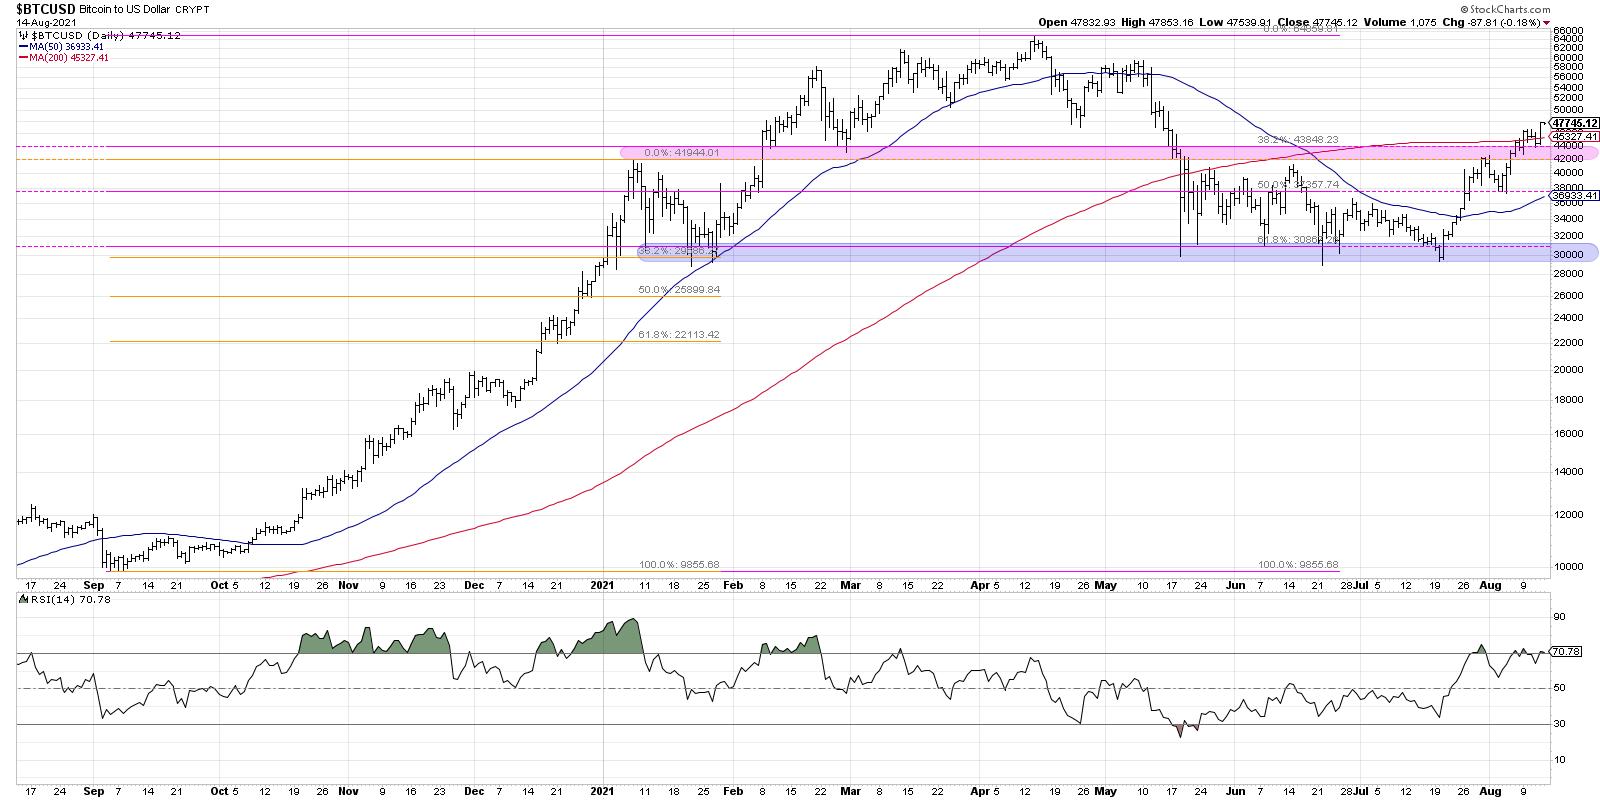
Scenario #2 that I mentioned earlier is a rangebound scenario between 42,000 and 54,000. The reason why I did not choose scenario #3 or #4 (the more bearish scenarios) is because the break above 42,000 was pivotal, as was the higher low around 38,000 in early August.
The trend appears positive until proven otherwise!
Why not the very bullish scenario of retesting all-time highs? That would actually be my second choice, but what prevents me from choosing that is a simple measuring technique using the trading range from May through July. Bitcoin trading from 30,000 to 42,000 means a range of around 12,000 points. If we add that range to the breakout level, we reach an upside objective of 54,000. I could see that becoming an upside objective that involves an exhaustion of buyers and/or an influx of selling pressure that would result in minimal upside follow-through.
The real point of this exercise, however, was to illustrate the benefits of considering alternative scenarios. We often get way caught up in one particular narrative, one particular thesis, one particular trade. The markets rarely do exactly what we expect. Investing is all about considering different scenarios, clearly defining your risk/reward and sticking to what the evidence is telling you. For now, it's telling me that the path of least resistance for Bitcoin is higher.
Want to digest this article in video format? Here you go!
RR#6,
Dave
PS- Ready to upgrade your investment process? Check out my free course on behavioral investing!
David Keller, CMT
Chief Market Strategist
StockCharts.com
Disclaimer: This blog is for educational purposes only and should not be construed as financial advice. The ideas and strategies should never be used without first assessing your own personal and financial situation, or without consulting a financial professional.
The author does not have a position in mentioned securities at the time of publication. Any opinions expressed herein are solely those of the author, and do not in any way represent the views or opinions of any other person or entity.


