My medium-term Market Trend Model turned bearish in May and has remained consistently bearish ever since. The market hasn't seemed to notice and has continued to make new all-time highs in every subsequent month.
So how do we reconcile these two conflicting signals, with a model turned negative and the major indexes pushing higher?
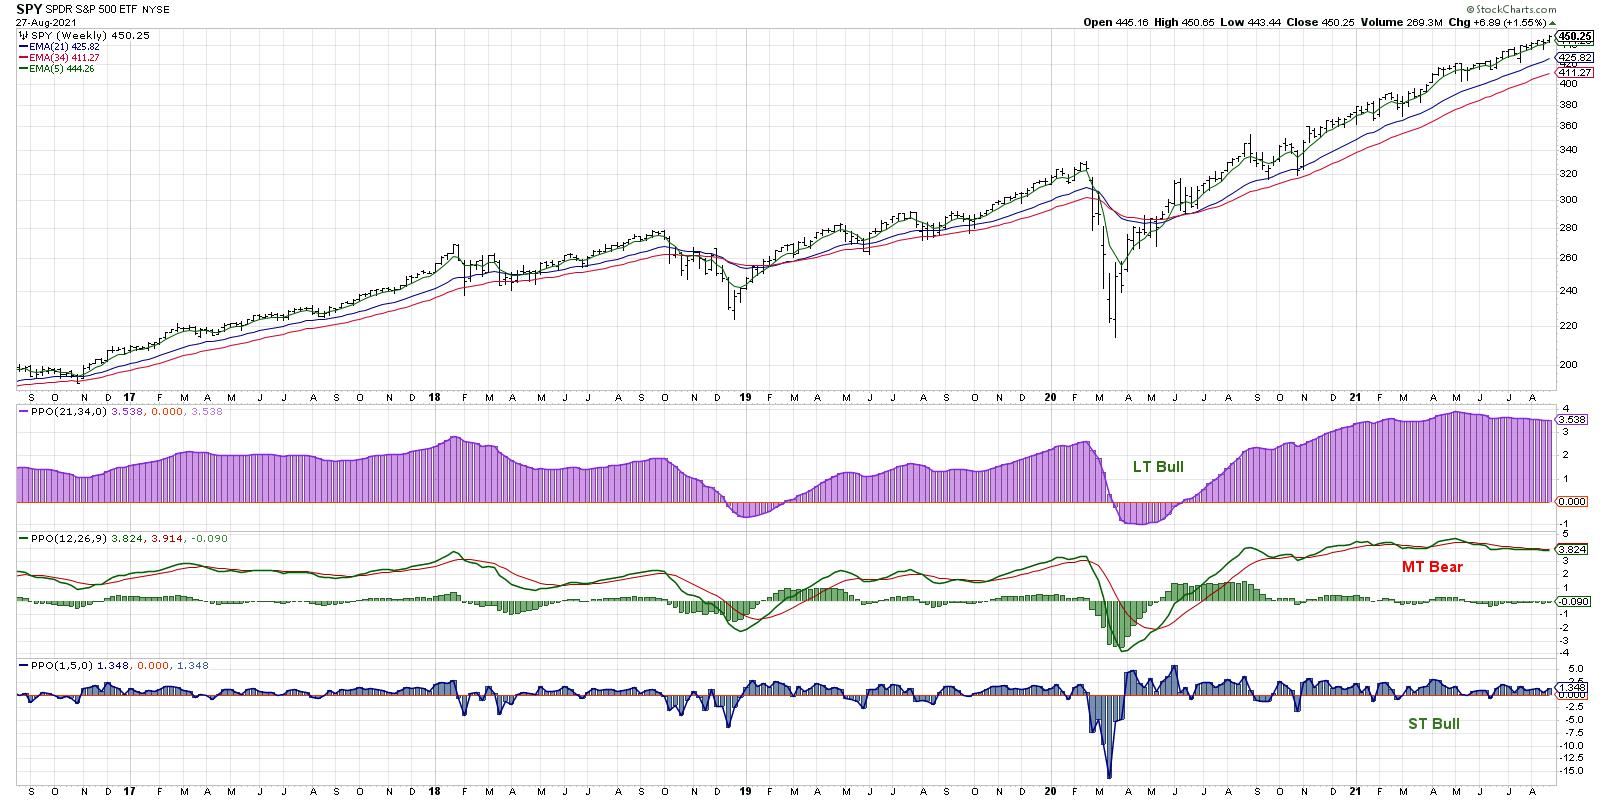
I would argue that the markets have been in a "stealth correction" since May, when cyclicals ceased their run of outperformance and sectors like Energy and Financials started to roll over on a relative basis. While the major indexes have continued to push to new highs every month, many stocks have experienced 10%, 20% or even 30% pullbacks during that same period. So the correction has certainly been happening all the while.
I saw three things this week that encouraged me to be less bearish about the markets as a whole (although, to be clear, I am as cautious as ever about the potential for downside!) and more constructive on prospects for equities between now and year-end.
First, the breadth deterioration has become less negative and is back to neutral/bullish.
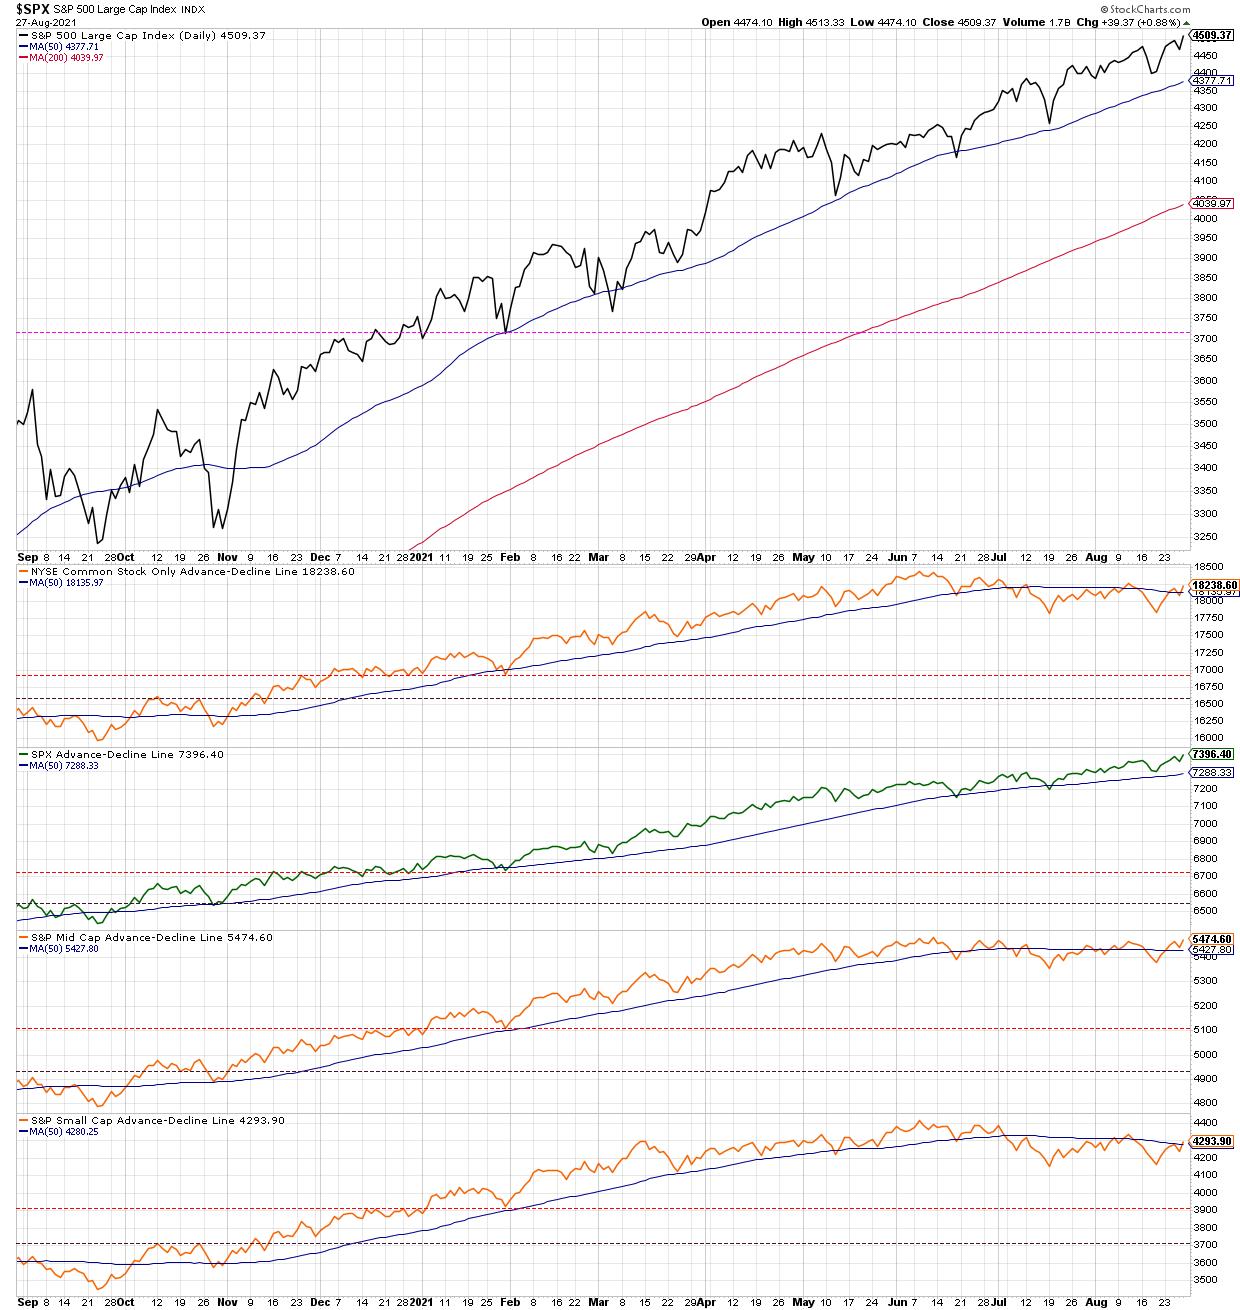
On The Final Bar earlier this week, my guest John Kosar from Asbury Research talked through his macro technical model, which recently rotated to all bullish signals. The last indicator to turn positive? The NYSE advance-decline line, which just rotated back above its 50-day moving average. While the S&P 500 advance-decline line has remained bullish through all of 2021, the mid- and small-cap names have experienced more drawdowns and thus the negative breadth picture. But that picture has become less negative this week.
Second, I'm finding plenty of names making new highs, particularly in sectors like Technology.
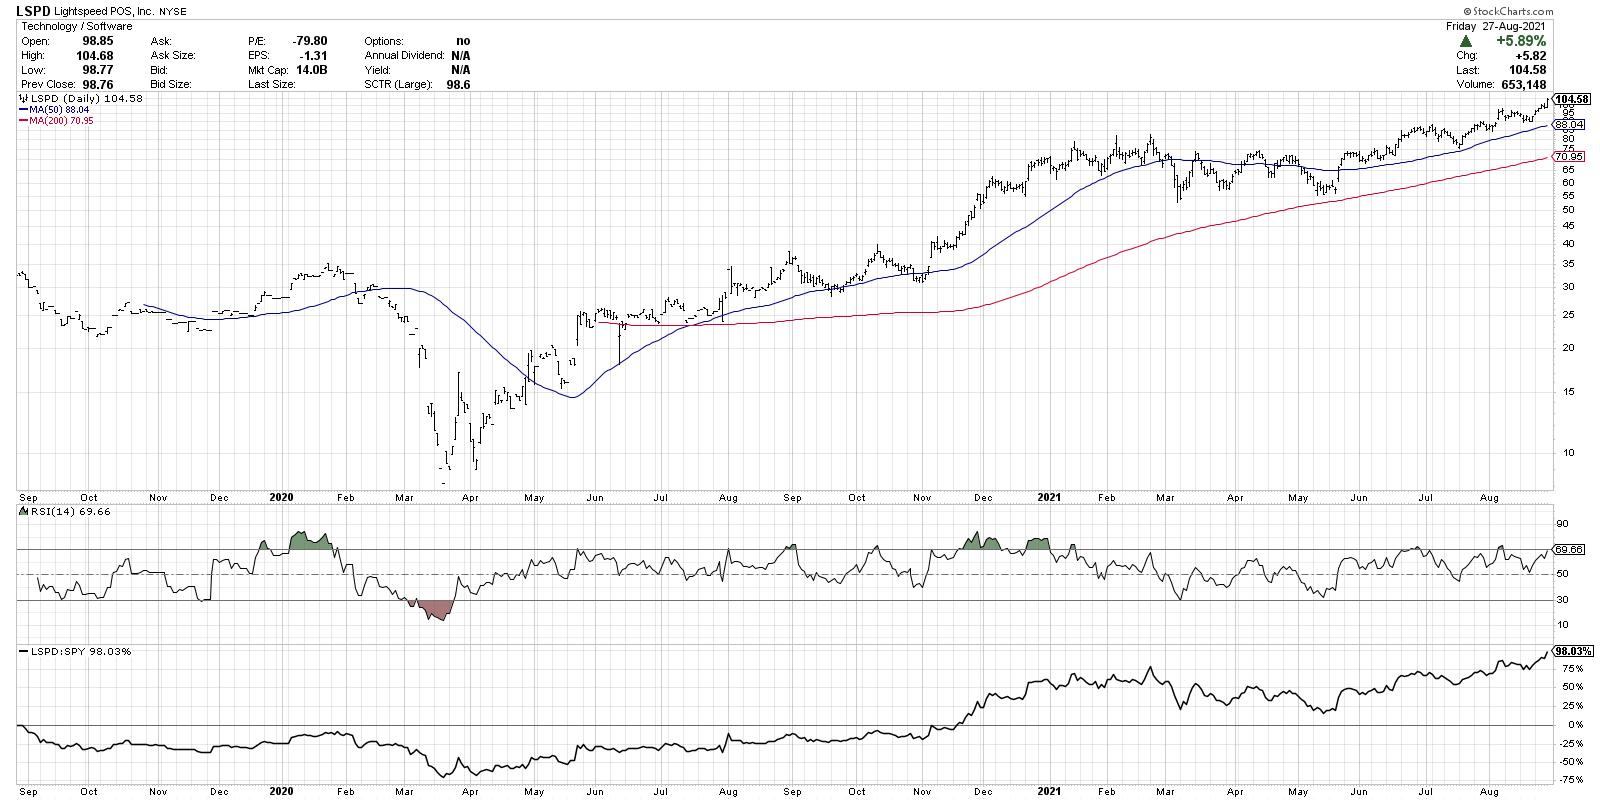
I often screen for stocks making new three-month highs and lows, as this can help identify not only stocks in long-term trends, but also charts that are just starting to break out of bases or below key support levels.
This week, I focused on a number of tech names that broke out of established bases with improving price and relative profiles. Lightspeed POS (LSPD) is a good example of this type of chart. While this chart alone should not cause one to be broadly bullish, the fact that I'm finding plenty of stocks breaking to new highs (about a six-to-one ratio new highs to new lows on Thursday) suggests broad participation to the upside.
Finally, I've noticed bullish momentum divergences on key groups, particularly the Energy sector.
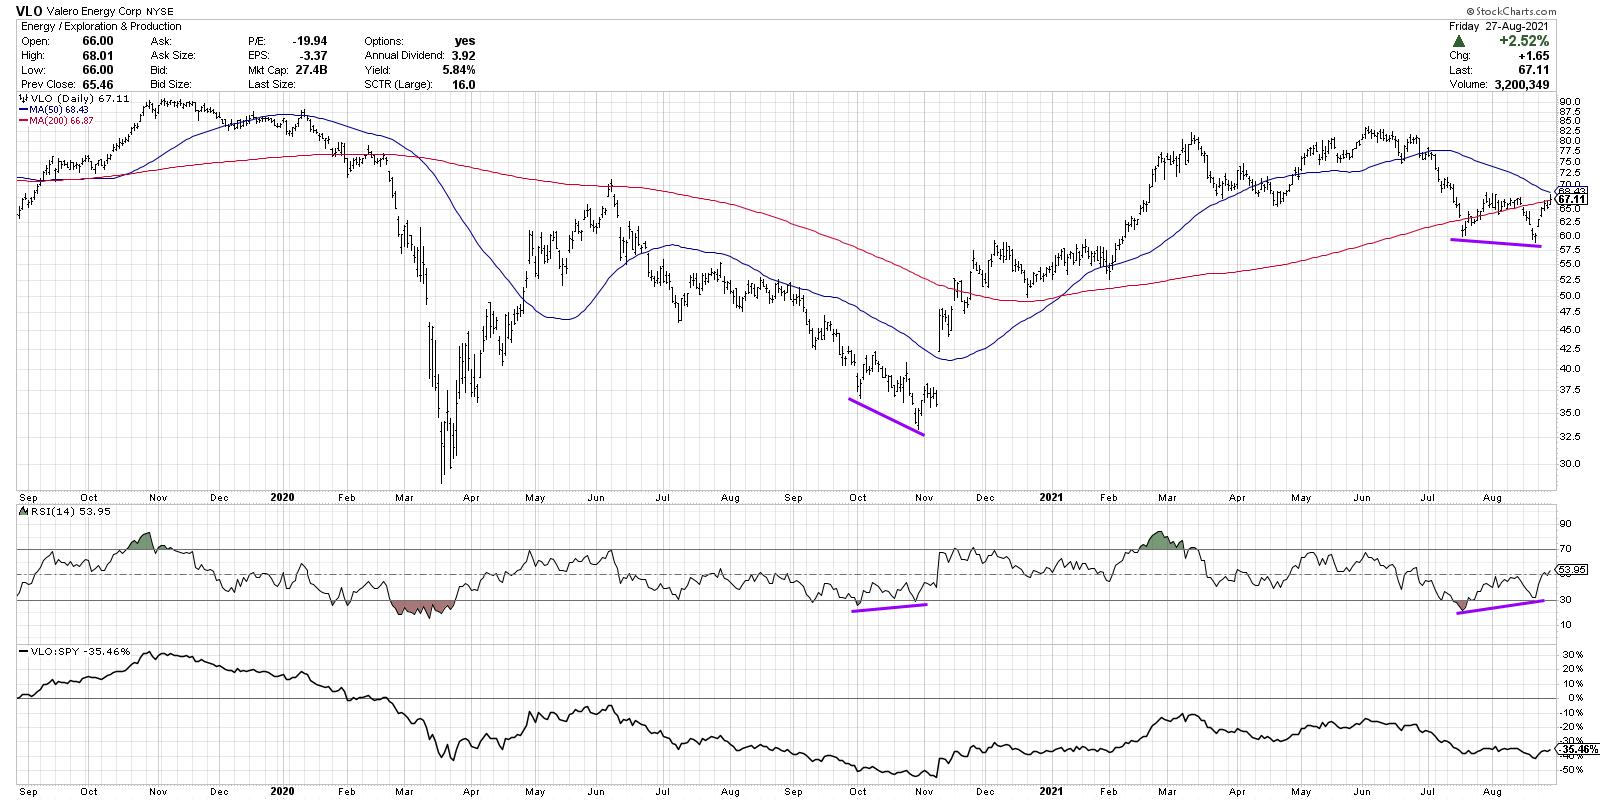
A bullish momentum divergence exists when price makes lower lows but an oscillator like RSI makes a higher low. We saw this back in October 2020 on stocks like VLO, when Energy was way off investors' radars after a run of underperformance. Soon after, Energy and Financial names rotated higher and outperformed growth sectors through the beginning of 2021. These stocks are now showing a very similar configuration, which suggests upside potential in a sector that has again lagged behind other stocks. This could suggest renewed leadership from cyclical sectors through year-end, as long as these stocks continue higher to validate this week's divergence.
One final note: I was recently asked about trailing stops and recorded a brief video about using support and resistance levels for charts like DIS to minimize downside risk. I also discussed the 50-day moving average, which, I would argue, is the most important line to watch for the S&P 500! More in the video below:
RR#6,
Dave
P.S. Ready to upgrade your investment process? Check out my free course on behavioral investing!
David Keller, CMT
Chief Market Strategist
StockCharts.com
Disclaimer: This blog is for educational purposes only and should not be construed as financial advice. The ideas and strategies should never be used without first assessing your own personal and financial situation, or without consulting a financial professional.
The author does not have a position in mentioned securities at the time of publication. Any opinions expressed herein are solely those of the author, and do not in any way represent the views or opinions of any other person or entity.


