Something changed on November 5, 2021.
The S&P 500 had successfully broken up through the previous resistance level around 4550; early November saw the benchmark continue higher to finally reach 2700 on November 5th. Until that first Friday in November, the S&P 500 appeared to be in a raging uptrend, with down days becoming a rare exception to the bullish daily move in stocks. From that day on, the S&P has transitioned from a bullish market to a sideways market, particularly on the short-term time frame.
My Market Trend Model has remained bullish on the long-term and medium-term time frames, suggesting the recent consolidation can be considered a pullback within the overall bullish trend for the S&P 500. But what about the momentum characteristics?
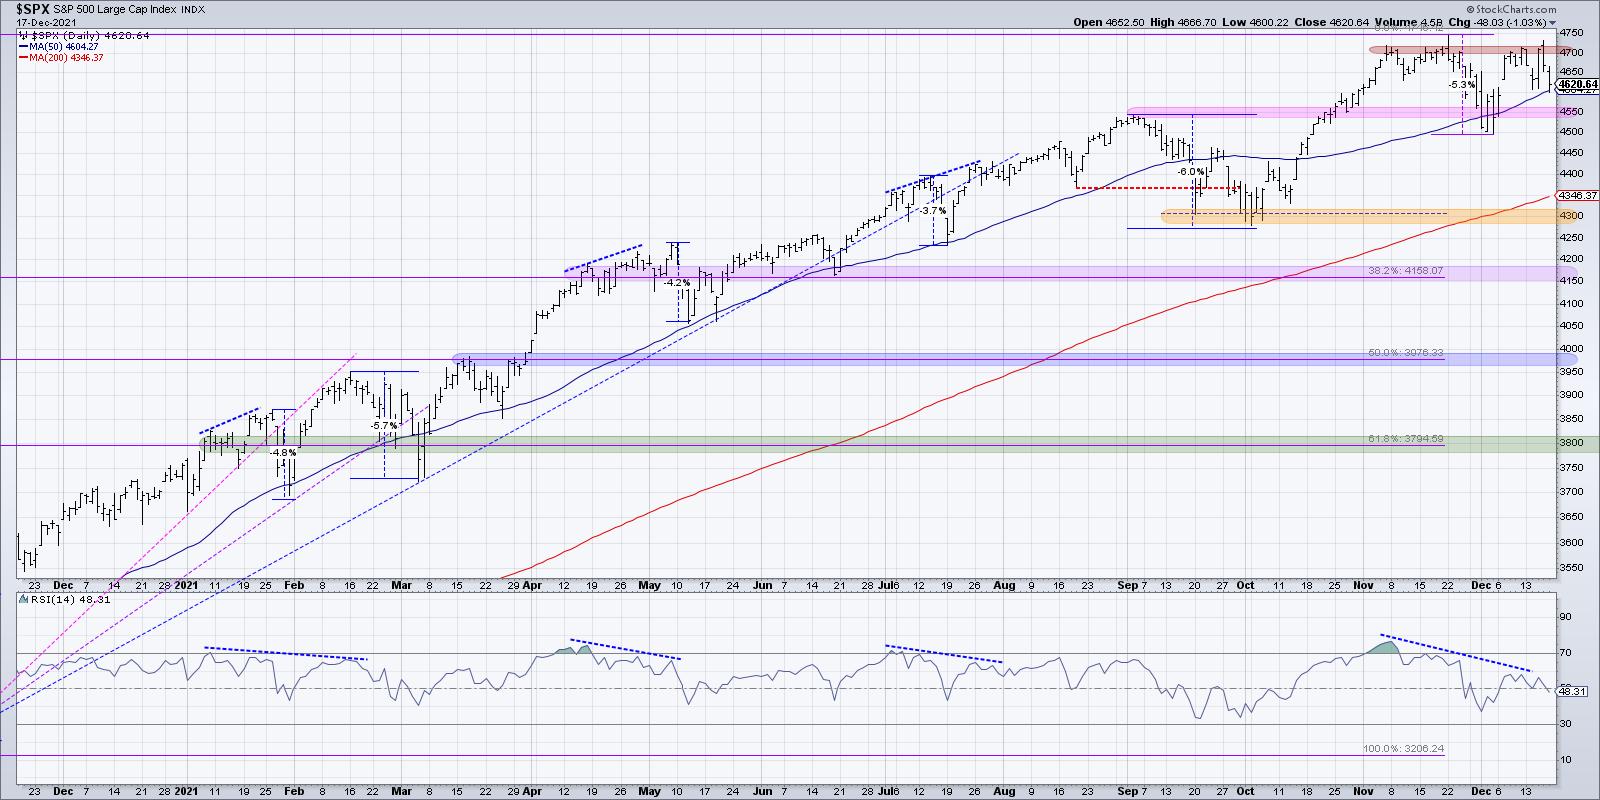
On November 5, as the S&P first reached 4700, the RSI peaked around 76. That was overbought, which indicated strong upside momentum into that new all-time high. On November 16, when the S&P reached 4700 for the second time, the RSI was around 70. When the S&P reached its highest level so far, 475 on November 22, the RSI was around 64.
This week, the highest reading for the S&P 500's RSI was around 55. That's right -- we have the dreaded bearish momentum divergence. Every time the most widely followed US equity benchmark reached 4700, the RSI has moved lower and lower. This is a sign of weakening buying power, with less and less momentum behind each attempt.
On my daily market recap show, The Final Bar, I try to remind viewers that your goal as an investor should be three steps:
- Identify trends.
- Follow those trends.
- Anticipate when those trends are exhausted.
The third step involves using charts to identify signs of trend exhaustion. Bearish divergences, using momentum indicators, breadth indicators or even volume, can be an indication that upside potential is limited, as the trend may be nearing an exhaustion point.
We have seen a bearish momentum divergence three times earlier in 2021. In January and February, we saw about a 5-6% correction to the 50-day moving average before the uptrend resumed. Then, in April and May, we saw another bearish divergence and the S&P pulled back around 4%. Finally, in July 2021, there was very little pullback after the divergence. The S&P accelerated to new highs on increasing momentum, effectively eliminating the bearish divergence condition.
What would confirm the current momentum reading and indicate a high potential for a market pullback? The S&P 500 actually touched its 50-day moving average on Friday of this week before closing just above that level. Previous bearish divergences in 2021 saw a pullback to around the 50-day moving average before resuming the longer-term uptrend. A break of the 50-day moving average next week would be a strong bearish signal, and a further drop below the 4500-4550 level would take the S&P below previous price support. In that case, you will see me writing articles about a strong potential for further downside price action!
On the other hand, what would invalidate this bearish divergence and indicate an "all clear" for the S&P? Similar to what we saw in August, a bearish divergence would be considered invalidated if you saw the price continue higher and with a higher RSI reading, not a lower one. In other words, you would need to see the market move higher on stronger momentum, not weaker momentum.
The S&P 500 has essentially been rangebound for the last six weeks, with 4500-4550 as support and 4700-4750 as resistance. The bearish divergence suggests that momentum is weakening and a move lower is a distinct possibility.
For now, I would identify key levels to watch for all your positions. Pay attention to market internals and look for downside follow-through. Most importantly, think of the S&P 500 in terms of probabilities, not certainties. You never know what tomorrow may bring!
For a video discussion on momentum divergence including one key stock showing a bullish divergence, head over to my YouTube channel:
RR#6,
Dave
P.S. Ready to upgrade your investment process? Check out my free course on behavioral investing!
David Keller, CMT
Chief Market Strategist
StockCharts.com
Disclaimer: This blog is for educational purposes only and should not be construed as financial advice. The ideas and strategies should never be used without first assessing your own personal and financial situation, or without consulting a financial professional.
The author does not have a position in mentioned securities at the time of publication. Any opinions expressed herein are solely those of the author, and do not in any way represent the views or opinions of any other person or entity.


