The VIX spiked above 30 this week, making that the highest level since January 2021. But is a rapid rise in volatility necessarily bearish for stocks?
In my conversation with Marc Chaikin earlier this week on The Final Bar, we talked about the move higher in the VIX and how that relates to previous pullbacks in 2021.
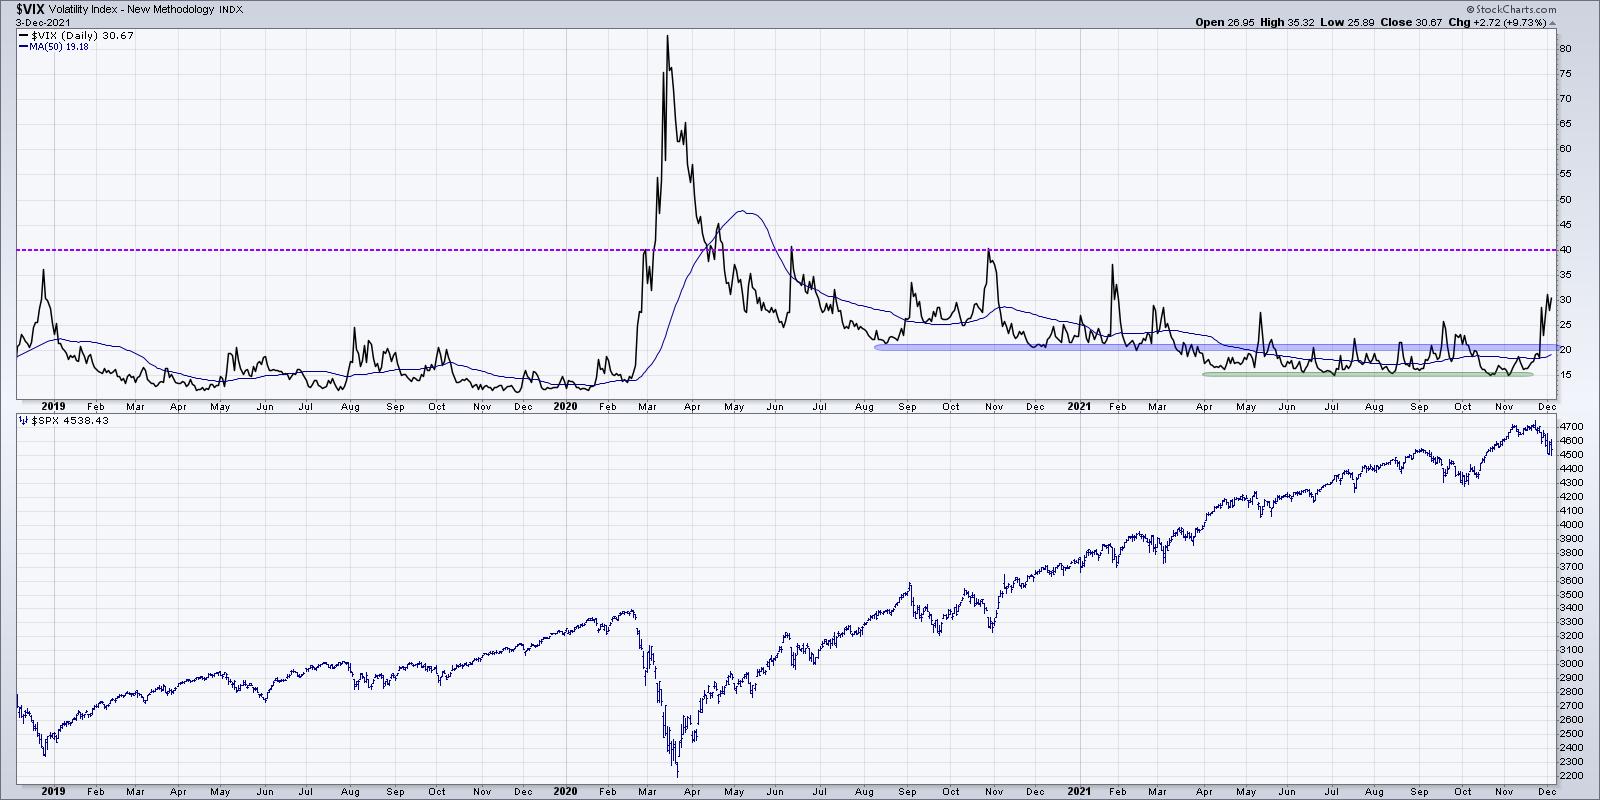
For much of this year, the VIX has been rangebound between 15 and 25. Readings above 25 have ended coinciding with buyable pullbacks in the S&P 500. In fact, this pattern worked every month from May through September, with brief selloffs in the major averages followed by continued upside. But this week, the VIX moved above 30 and now is in line with the elevated levels we saw back in 2020. Selloffs in the first 12 months after the March 2020 saw the VIX rising up to 40. These spikes in volatility lined up well with market pullbacks.
As we can see, the problem is that the VIX does not really have a defined ceiling. Considering a reading of "elevated" depends very much on the context. A VIX level of 20 was high for 2021, but quite low for 2020! Due to the inverse relationship between the VIX and SPX, I think that showing the VIX inverted can better illustrate the interplay between these two series.
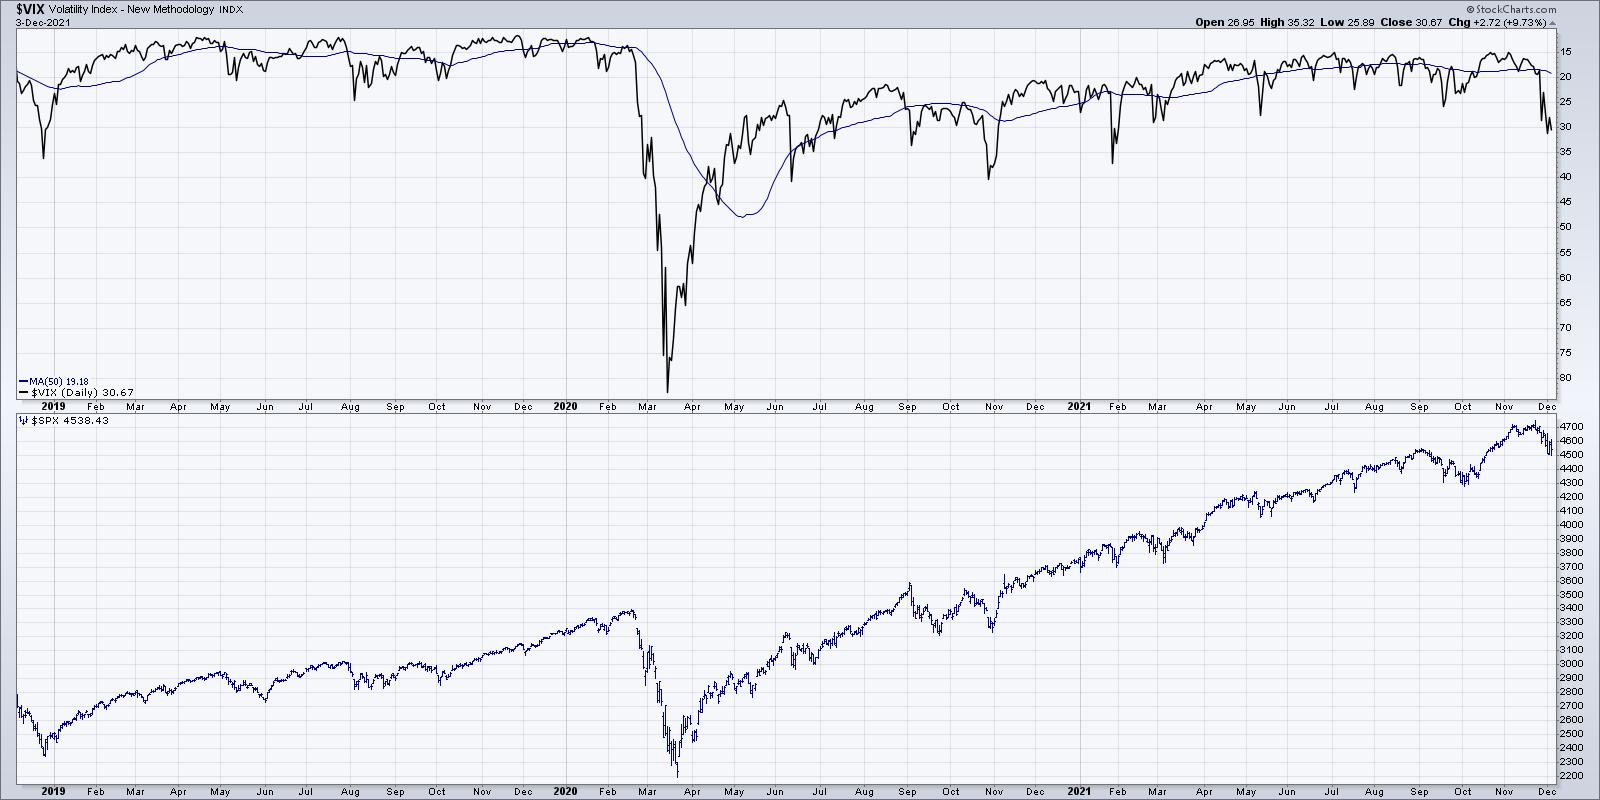
Now you can see the clear relationship between the price of the S&P 500 and the VIX, which is basically showing the implied volatility of options on the S&P 500 index. What's notable here for me is that the VIX has spiked much higher than the September peak. It's interesting that the VIX has far eclipsed its September level, while the S&P 500 itself has not yet broken that price support around 4300.
What also stands out on this chart is how far the VIX increased in February and March 2020. So, while the current rise is sudden and notable, it would have to move much further to line up with more significant market corrections.
So the answer is "it depends".
The VIX is known as the "fear gauge", but I like to think of it as more a measure of uncertainty than fear. Does a spike in the VIX line up with buyable pullbacks over the lasts 18 months? Absolutely. Does a spike in the VIX also line up with the beginning of much deeper bear market phases? Also yes.
In the end, the rapid increase in volatility simply indicates an increase in uncertainty. That means this is an ideal time to clearly define your risk, focus on "lines in the sand" of support on your charts and let the charts help you manage potential further downside for stocks.
Want to digest this article in video format? Here we go:
RR#6,
Dave
P.S. Ready to upgrade your investment process? Check out my free course on behavioral investing!
David Keller, CMT
Chief Market Strategist
StockCharts.com
Disclaimer: This blog is for educational purposes only and should not be construed as financial advice. The ideas and strategies should never be used without first assessing your own personal and financial situation, or without consulting a financial professional.
The author does not have a position in mentioned securities at the time of publication. Any opinions expressed herein are solely those of the author, and do not in any way represent the views or opinions of any other person or entity.


