The Hindenburg Omen is a bit of a controversial indicator. I often get asked about it from financial media outlets, as the name itself is enough to stir up investor fear. What is this indicator, and what can it tell us about current market conditions?
The Hindenburg Omen was developed by Jim Miekka and basically is designed to look for conditions that are consistent with major market tops. One word of caution: it is not 100% accurate (as much as we often wish technical indicators would be!). As one mentor of mine once put it, the Hindenburg Omen has called ten of the last three market corrections!
This is essentially a breadth indicator combining three separate inputs along with a time factor. Let's review these three inputs and what they really represent.
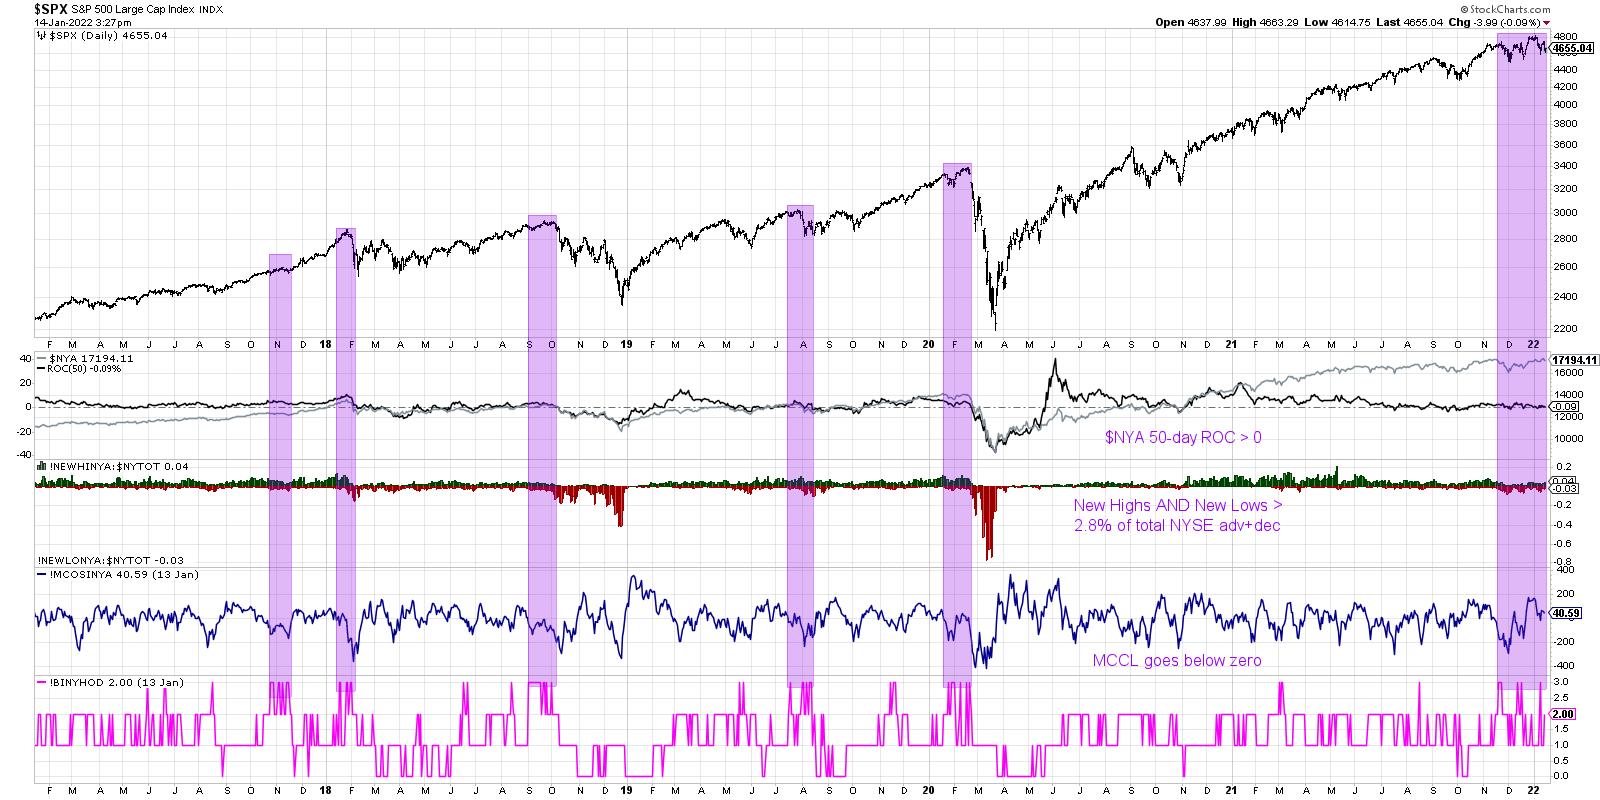
First, we need the overall market to be in an established uptrend. Now, there are a number of ways to make this determination, including the slope of the 50-day moving average, or perhaps just making sure the Dow is above a long-term moving average. But I tend to use the 50-day rate of change on the NYSE Composite Index ($NYA). As long as this value is above zero, then the $NYA is higher than it was ten weeks ago.
Once we've established the overall market uptrend, we need to review the new 52-week highs and lows for the NYSE. This is where it gets a bit interesting. Miekka identified that major market tops often experience an expansion in new highs AND new lows. That is, some stocks are breaking out to the upside while others are breaking down to new swing lows. It turns out that there is often indecision at the end of the bull market run. When the new highs and new lows are both at least 2.8% of NYSE listings (actually, I believe Miekka used the advancers + decliners instead of total NYSE listings) then we have achieved this second condition.
The third piece to the Hindenburg picture involves the McClellan Oscillator, a common measure of market breadth based on exponential moving averages of the advance-decline line. When the McClellan Oscillator breaks below zero, it basically indicates that the momentum of net advancers is turning negative. This suggests breadth deterioration and further downside for major indexes.
So far, we have shown how the Hindenburg Omen basically looks for a market in an established uptrend, a state of indecision with a significant number of both new highs and new lows, followed by breadth conditions turning negative.
Now we get to the final aspect to this popular indicator, the time factor. A valid Hindenburg Omen signal needs to have multiple signals within a 30-day window to actually register a valid bearish indication. That is, we need to see the combination of those three pieces of the indicator on two separate occasions within a 30-day window. StockCharts makes this analysis fairly easy, as we have developed an indicator that aggregates the three components of the Hindenburg Omen.
The bottom panel on the chart above is an indicator (!BINYHOD) that tracks the three components. If all three have triggered, the indicator shows a value of 3. If none of them are currently triggered, the indicator shows a value of zero.
I have shaded in purple the times where the Hindenburg Omen was triggered in multiple signals within a 30-day period. In three of those instances (Feb 2020, Sep 2018 and Jan 2018), the market sold off soon after this cluster of signals. Two others were somewhat less successful. In August 2019, the market had already pulled back by the time the indicators was triggered and there was limited downside in the weeks to come. November 2017 saw another cluster of signals, but the market did not even pause en route to the eventual high in January 2018.
You'll notice on the far right side of this chart that we have now registered a valid Hindenburg Omen over the last two months. So how should investors proceed? Very cautiously.
Given the fact that the indicator tends to give false positives, taking significant action based purely on this signal may not be warranted. But it does tell me to focus in on key risk levels to identify if and when a selloff begins. For the S&P 500 index, the 4550 level remains the most important one to watch. If we do see a break of S&P 4550 after the Hindenburg Omen has been registered, the coming weeks and months may be bring elevated risk of market downside!
Want to digest this article in video format? Check out my YouTube channel!
RR#6,
Dave
P.S. Ready to upgrade your investment process? Check out my free course on behavioral investing!
David Keller, CMT
Chief Market Strategist
StockCharts.com
Disclaimer: This blog is for educational purposes only and should not be construed as financial advice. The ideas and strategies should never be used without first assessing your own personal and financial situation, or without consulting a financial professional.
The author does not have a position in mentioned securities at the time of publication. Any opinions expressed herein are solely those of the author, and do not in any way represent the views or opinions of any other person or entity.


