I recently posted a video on four potential paths for the S&P 500, from the very bullish (S&P gets over 4800 in the next six weeks) to the very bearish (S&P breaks below 4000). Today, I wanted to dig a little deeper into using Fibonacci retracements to identify potential downside targets and discuss why 3800 may become an eventual low for the S&P 500 index.
Fibonacci retracements are a bit of a subjective measure. While there is no real wiggle room in the values used in the calculations (61.8%, 38.2%, etc.), there is plenty of subjectivity in terms of which levels you assign as 0% and 100%. In my recent notes on the S&P 500, I've been using the September 2020 low and the January 2022 high as the price extremes. This results in a 38.2% retracement level right around 4200. That's right, the 4200 we just barely reached earlier this week.
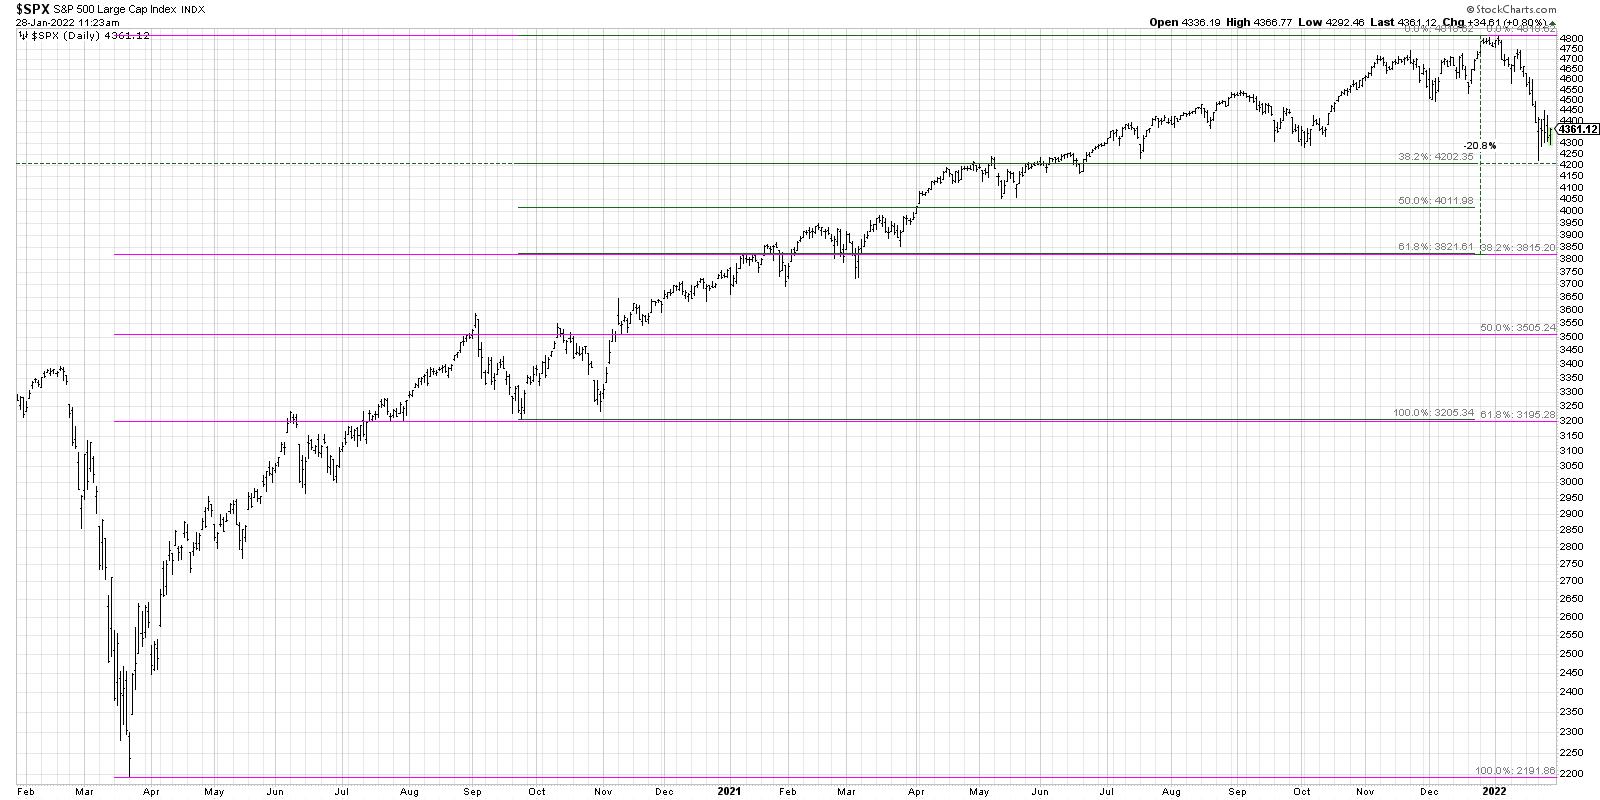
The general approach to Fibonacci analysis is that you expect support at the first level. If and when that level is breached, you use the next level as your new target. So that would mean that, if 4200 is broken on a closing basis, the next downside price objective would be the 50% retracement level around 4000. If 4000 would fail to hold, then the next downside objective for the S&P 500 would be around 3800, which would represent a 61.8% retracement of the September 2020 to January 2022 rally.
But what if we use the March 2020 low instead of the September 2020 low as the 0% level? Now we are looking at the entirety of the 2020-2022 bull market phase. Using those new extreme levels, we arrive at a 38.2% retracement level right around 3800. That's almost identical to the 61.8% level we mentioned earlier. 3800 would also represent a drawdown of just over 20% off the January peak at 4800 and would mean the S&P would be dangerously close to the dreaded "bear market" level.
With the rally into Friday's close this week, many will be speculating that this is yet another "buy on the dip" moment among many we've seen during this bull market phase. But deeper and more painful corrections usually look like this just before things start to get really ugly. Is it the most likely scenario? Perhaps. Is it a very real possibility? Absolutely. And mindful investors always consider all the potential outcomes!
Want to see more on four potential future paths for the S&P 500 index, and what they may mean for your portfolio? Check out my YouTube channel!
RR#6,
Dave
P.S. Ready to upgrade your investment process? Check out my free course on behavioral investing!
David Keller, CMT
Chief Market Strategist
StockCharts.com
Disclaimer: This blog is for educational purposes only and should not be construed as financial advice. The ideas and strategies should never be used without first assessing your own personal and financial situation, or without consulting a financial professional.
The author does not have a position in mentioned securities at the time of publication. Any opinions expressed herein are solely those of the author, and do not in any way represent the views or opinions of any other person or entity.


