The Ichimoku cloud model (often just referred to as the "cloud model") is a traditional Japanese technical indicator which actually combines three separate trend-following devices. I spent some time on Japanese trading desks earlier in my career, and was always fascinated at how much I would see candlestick charts and the Ichimoku clouds all around me. What's compelling about the Ichimoku indicator is that, with one glance, you can form a fairly complete picture of the trends of an underlying asset.
My recent interview with Katie Stockton of Fairlead Strategies encouraged me to spend some time with the Ichimoku charts this week, and I wanted to share some of my takeaways. Our Chart School section has some fantastic articles on the Ichimoku system, but today we'll focus on what the cloud portion of the indicator can tell us about the current market environment.
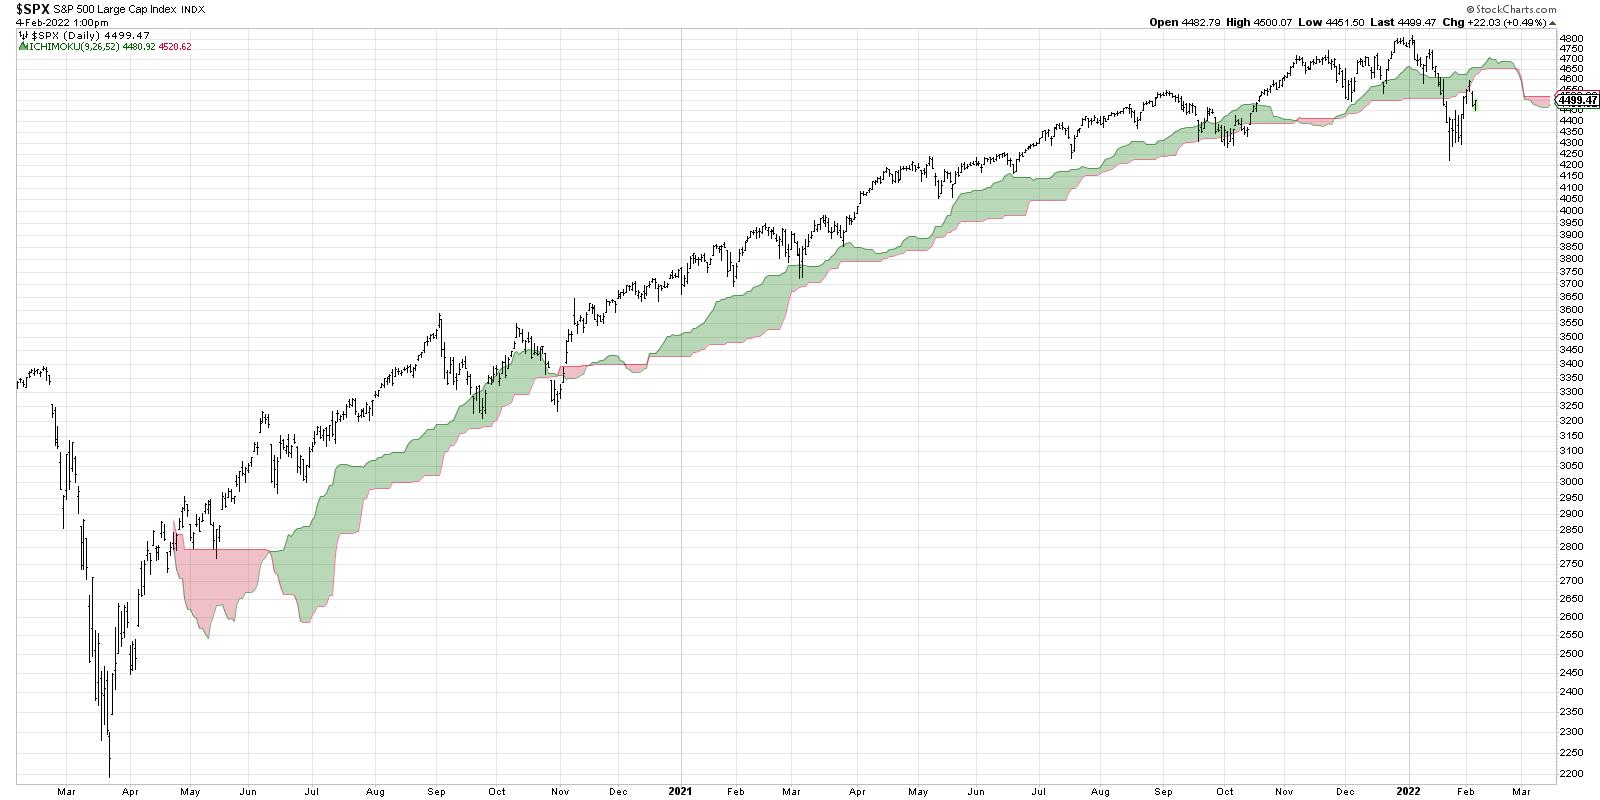
One thing you'll notice immediately is that the cloud is plotted 26 days in the future. This is one of the few technical indicators that actually has a true forward-looking component! The cloud is determined by using some of the other components of the Ichimoku system, but, basically, is looking at the midpoint of price ranges over a certain lookback period. What is the average of the highest high and lowest low over the previous nine days? You make similar calculations for different time periods and eventually you arrive at the cloud you see on the chart of the S&P 500.
How do we use the cloud? First, it can tell you the overall trend of the asset. I think of markets in three phases:
- Accumulation Phase with higher highs and higher lows
- Distribution Phase with lower highs and lower lows
- Consolidation Phase with overall sideways, rangebound price action
If the cloud is green and sloping higher, we are in an accumulation phase. If the cloud is red and sloping lower, we are in a distribution phase. If the cloud is flat, we are in a consolidation phase.
Next, we can look at the price relative to the cloud. During an accumulation phase, the price will often find support in the cloud. Note the pullbacks for the S&P 500 in September 2020, March 2021 and December 2021. Most recently, we saw the S&P 500 break below the cloud, then retest the cloud from below and find resistance in this key area. Support has now become resistance!
Finally, the forward-looking components allows us to identify potential resistance levels in the next 4-5 weeks. So we have a sense of where any impending rally may find resistance, as well as an idea of what the S&P would need to do to reverse from distribution phase to accumulation phase.
What does all of the above tell us about the current market environment? As long as the S&P remains below the cloud, the trend is bearish (at least according to this indicator). If we do see a rally here in the coming weeks, expect resistance in the cloud, which currently ranges between 4500 and 4650, depending on how quickly the price would increase.
What's great about the Ichimoku cloud model is that it can be used along with other technical indicators like support and resistance, oscillators like RSI, and especially candlestick charts. When you see a significant candle pattern that occurs just as the price is entering the cloud, prepare for a price reversal!
Want to digest this article in video format? Head over to my YouTube channel!
RR#6,
Dave
P.S. Ready to upgrade your investment process? Check out my free course on behavioral investing!
David Keller, CMT
Chief Market Strategist
StockCharts.com
Disclaimer: This blog is for educational purposes only and should not be construed as financial advice. The ideas and strategies should never be used without first assessing your own personal and financial situation, or without consulting a financial professional.
The author does not have a position in mentioned securities at the time of publication. Any opinions expressed herein are solely those of the author, and do not in any way represent the views or opinions of any other person or entity.


