The major equity averages finished the week in a position of weakness, with the S&P 500 index once again testing the key support level of 4200.
We've talked about the 4200 level many times for the S&P 500, most recently in terms of that relates to the bullish momentum divergences we've noticed on the SPX and a number of large-cap stocks. When the S&P and Nasdaq are testing key support levels, it's often a good idea to check out some of the larger names that comprise those indexes. The major averages will be unable to hold support if mega-cap stocks are unable to do the same.
That brings us to the chart of Apple (AAPL), which, up until this week, has shown fairly consistent outperformance over the last nine months.
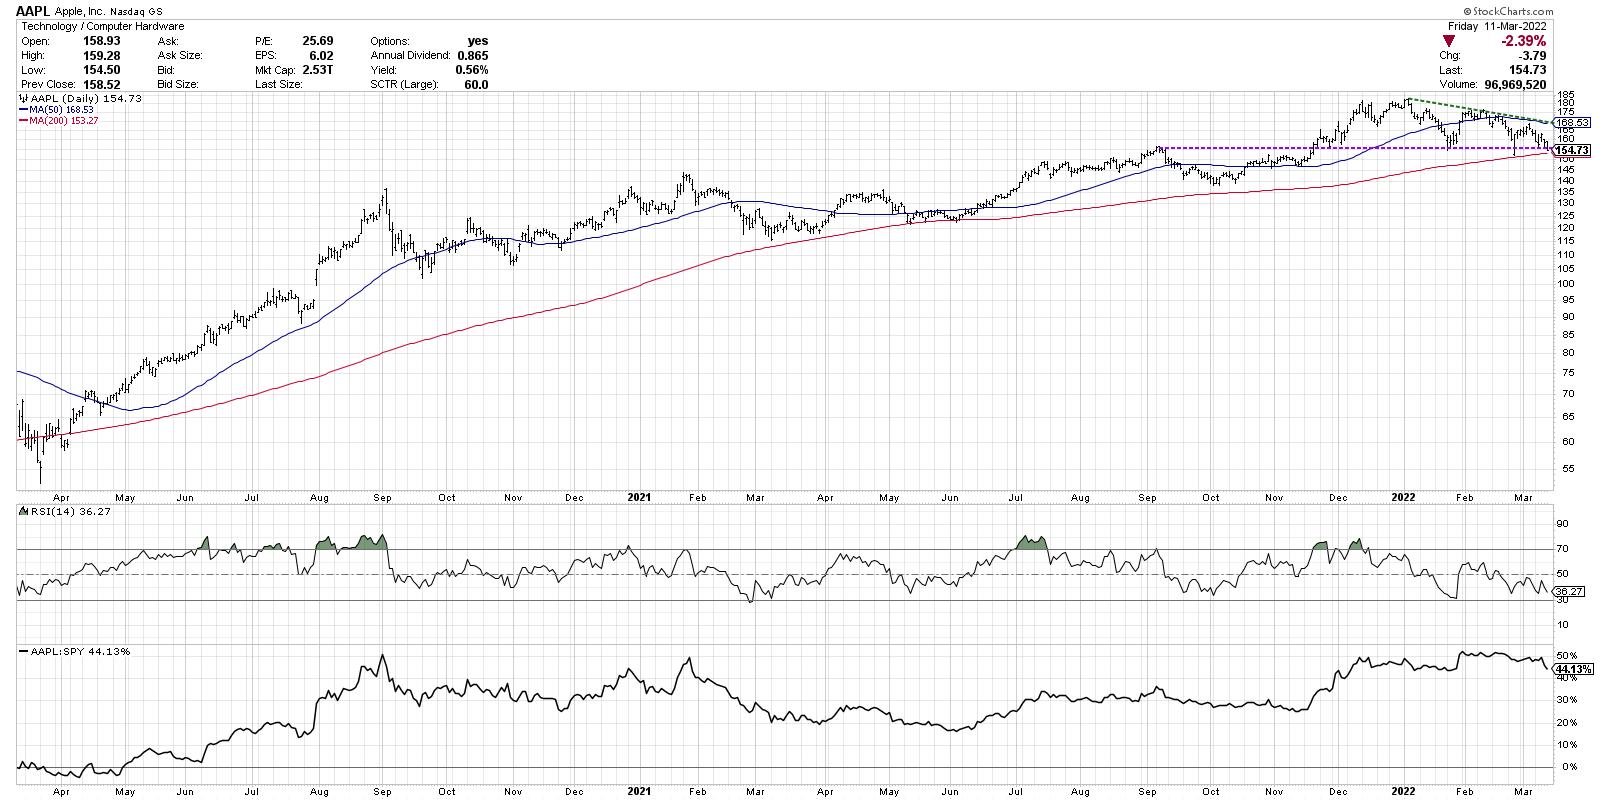
AAPL first reached the $155 level in September 2021; then, in November, the stock broke above that level and successfully retested it from above. Apple then gained another 25 points to reach its eventual peak around $180 in early December. From there, the stock has pounded out a steady pattern of lower highs, so far putting in a lower high in February and March.
Now we find this mega-cap technology name pulling back once again to the $155 level. Previous lows in January and February have occurred right around this same price point.

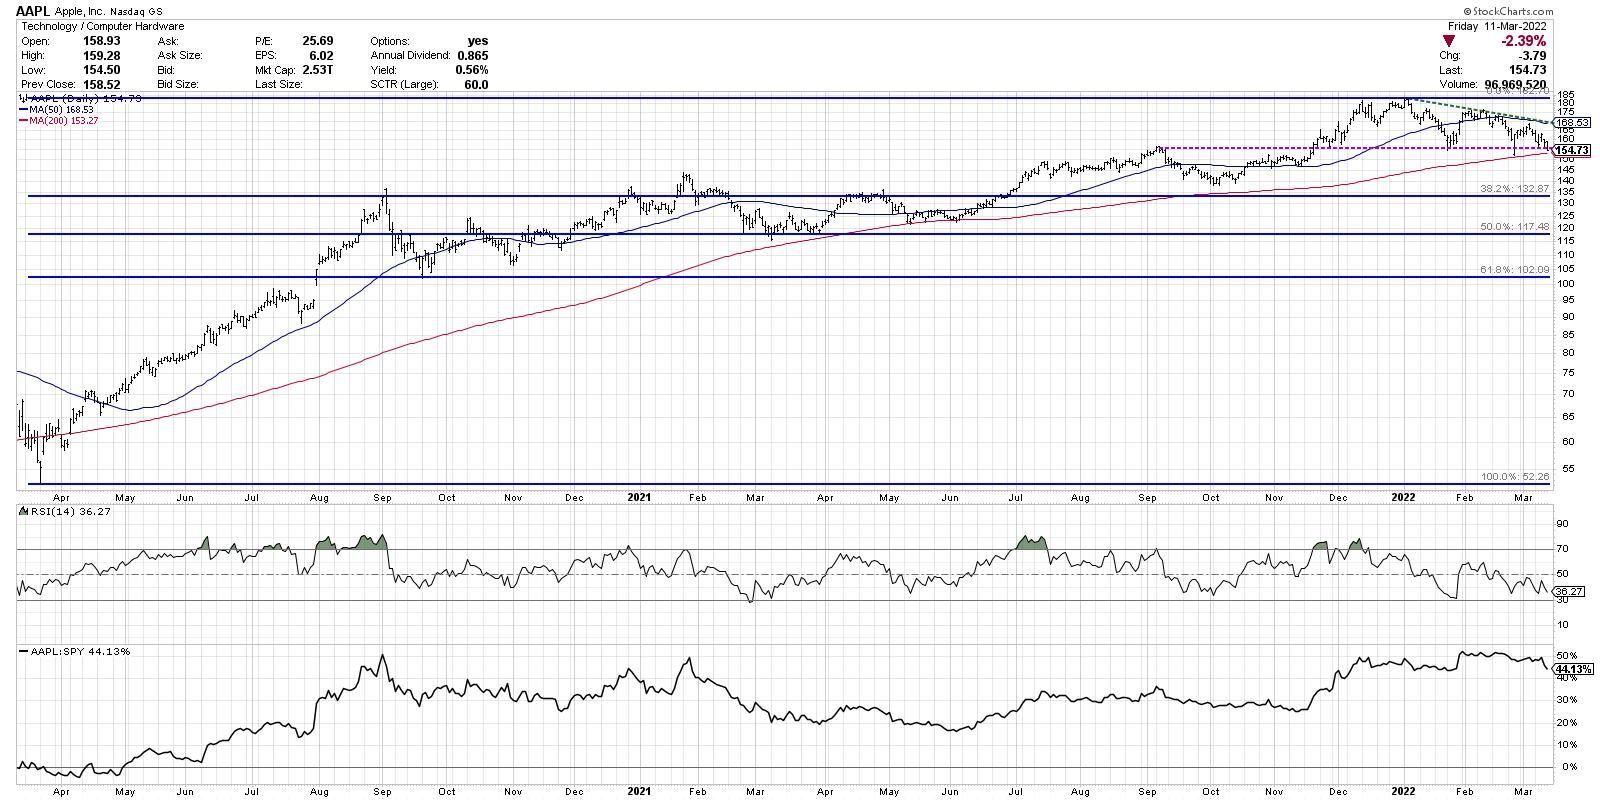
What's different this time is that it also coincides with the 200-day moving average. Do we once again see an influx of buying power to cause the stock to bounce once again off $155? Market bulls had better hope so. Because if AAPL breaks support at $155 (which I believe it will, most likely next week), then the next level of potential support would be in the 132-140 range. The low in October 2021 was around $140, and the first Fibonacci support level (using the March 2020 and January 2022 range) comes in around $132.
What would tell me this bearish thesis is incorrect? Two things come to mind.
First, AAPL would need to break above trendline resistance using the January and February peaks. The trendline currently sits right around $168. The 50-day moving average is right around this price level as well, so a move above $168 would clear two important technical hurdles.
The other indicator I'm watching is RSI. The RSI for Apple has been in a bearish configuration (below 60) since December of last year. If the RSI would break back above 60 on a price bounce, that could indicate an influx of buyers with enough momentum to push the price even higher.
As investors are dealing with a number of concerning macro themes in recent weeks, the Fed meeting coming up next week could be just the catalyst to move charts like AAPL into a new downward phase of this bear market experience.
Want to digest this article in video format? Just head over to my YouTube channel!
RR#6,
Dave
David Keller, CMT
Chief Market Strategist
StockCharts.com
Disclaimer: This blog is for educational purposes only and should not be construed as financial advice. The ideas and strategies should never be used without first assessing your own personal and financial situation, or without consulting a financial professional.
The author does not have a position in mentioned securities at the time of publication. Any opinions expressed herein are solely those of the author, and do not in any way represent the views or opinions of any other person or entity.


