Jesse Livermore famously said, "There is a time to go long, time to go short and time to go fishing."
On a Fed meeting day, I often find that it's one of those "fishing" days. Plenty of speculators will try and game this meeting based on short-term movements leading up to the announcement or play the reaction afterwards as everyone hangs on Powell's every word. I've found that, as a medium-to-long-term investor, it's often best to sit back and let things settle down before planning your next move.
Given the sharp countertrend rally this week leading up to the Fed meeting, I thought it would be helpful to take a step back and reflect on key levels for the S&P 500.
Are you familiar with market sentiment indicators like the VIX, AAII survey and Rydex flows? Join my upcoming FREE webinar on March 22nd as I break down these indicators and what they can tell us about the current bear market phase! Sign up HERE.
When you focus on short-term market moves, every little flickering tick seems to be super important. When you focus more on big picture price levels to watch, then the short-term movements are more noise as the market makes its way to generating a signal that is worthy of your time and attention!
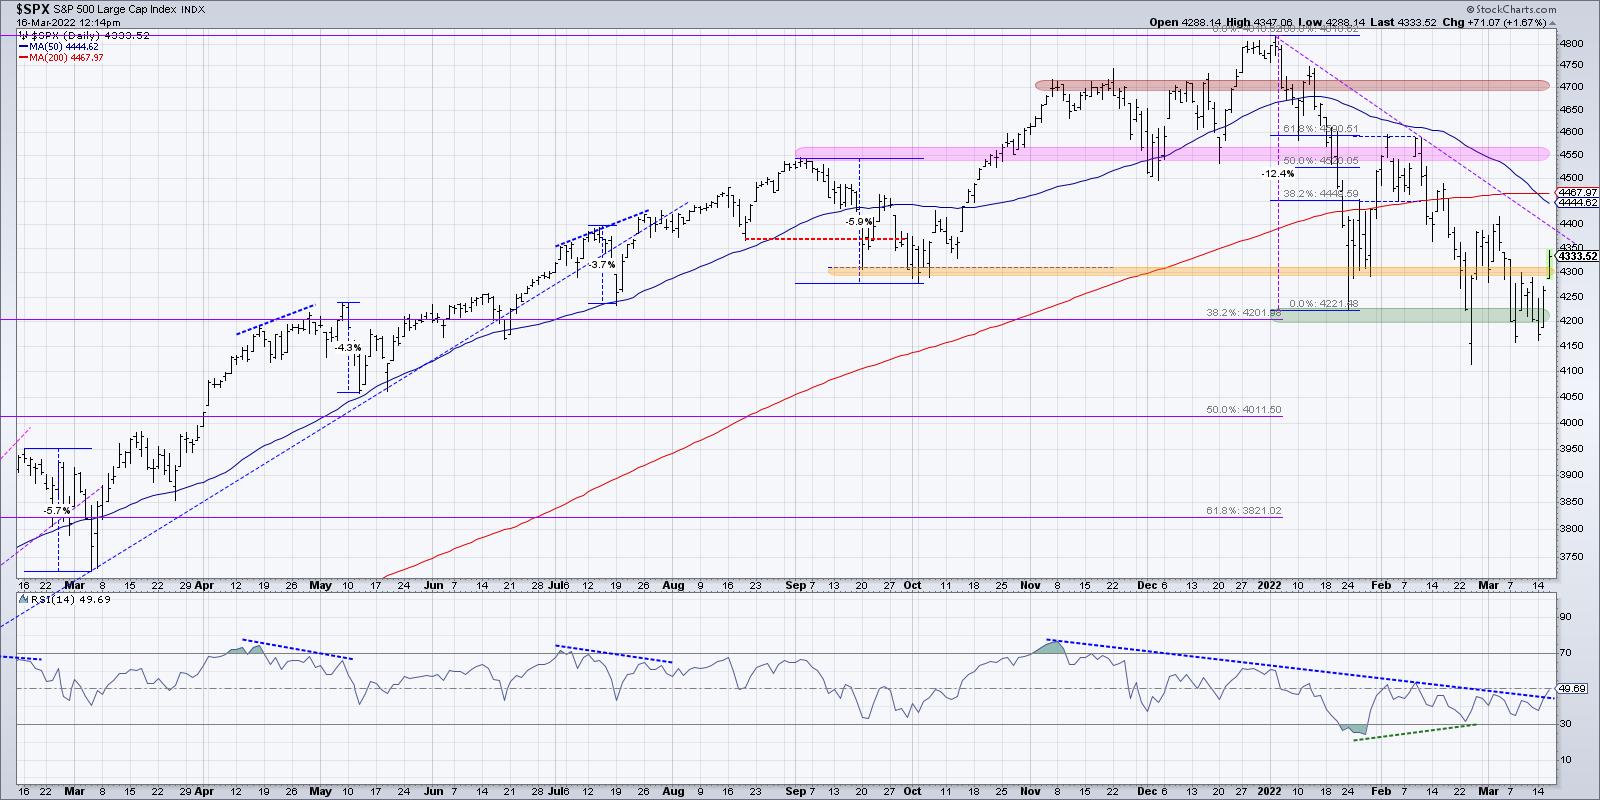
I see the S&P as essentially rangebound, with the RSI almost dead neutral at 50. This represents an absence of momentum and suggests that, overall, buying and selling pressure is at an equilibrium.
At some point, one of two things will happen.
The bull case involves the S&P 500 breaking above trendline resistance, which would mean a close above 4400. That would also push the SPX above its most recent swing high, which it has not actually done since January! The RSI would increase in that scenario, and a push above the RSI 60 level would convince me that buying power has emerged with enough momentum to propel the market back to the upper end of its six-month range.
The bear case would mean the S&P 500 finally breaks below the 4200 level and actually confirms the breakdown. You see, when price hits support, you'll often see just once close below the support level, before the price then immediately bounces higher. This indicates that buyers are stepping in and literally providing the support that the chart would suggest. Every time that support level is similarly tested, it serves to further validate the importance of the price level going forward.
The SPX has bounced off 4200 a number of times in 2022 (see the green-shaded area on the chart) which tells me that a confirmed break below 4200 would clear the way to my downside target of 3800.
John Bollinger once told me that a period of consolidation often precedes a momentum breakout. All you need to do is see which way the price breaks out of the consolidation pattern. The levels are set on my chart of the S&P 500. Which way do we break?
Want to learn technical analysis? Well, there's a right way and a wrong way. For the right way, check out my latest YouTube video:
RR#6,
Dave
David Keller, CMT
Chief Market Strategist
StockCharts.com
Disclaimer: This blog is for educational purposes only and should not be construed as financial advice. The ideas and strategies should never be used without first assessing your own personal and financial situation, or without consulting a financial professional.
The author does not have a position in mentioned securities at the time of publication. Any opinions expressed herein are solely those of the author, and do not in any way represent the views or opinions of any other person or entity.


