In a fantastic sign of the times, I find myself writing an article with a legitimate discussion as to which of these two sectors has a more attractive technical setup - Utilities or Technology.
For younger investors, the idea that anything other than Technology would be leading the market is a bit of a head-scratcher. How should a boring utility company be outperforming a leading-edge technology firm?
I've learned that "should" is indeed a four-letter word for investors. Down the road, people will debate why gold outperformed the S&P 500, or why banks underperformed during a rising rate environment, or whatever particular reality actually plays out. Technical analysis is not about what should happen, but about what is happening. The reasons for why this is the case often appear crystal clear in the rear-view mirror!
That brings up to today's comparison between Utilities and Technology. If we look at the long-term chart, going back to the 2009 market bottom, you can see that indeed the Technology sector has been a fairly consistent outperformer. In fact, there are only brief periods where Utilities have been able to outperform (i.e. where this ratio turns lower).
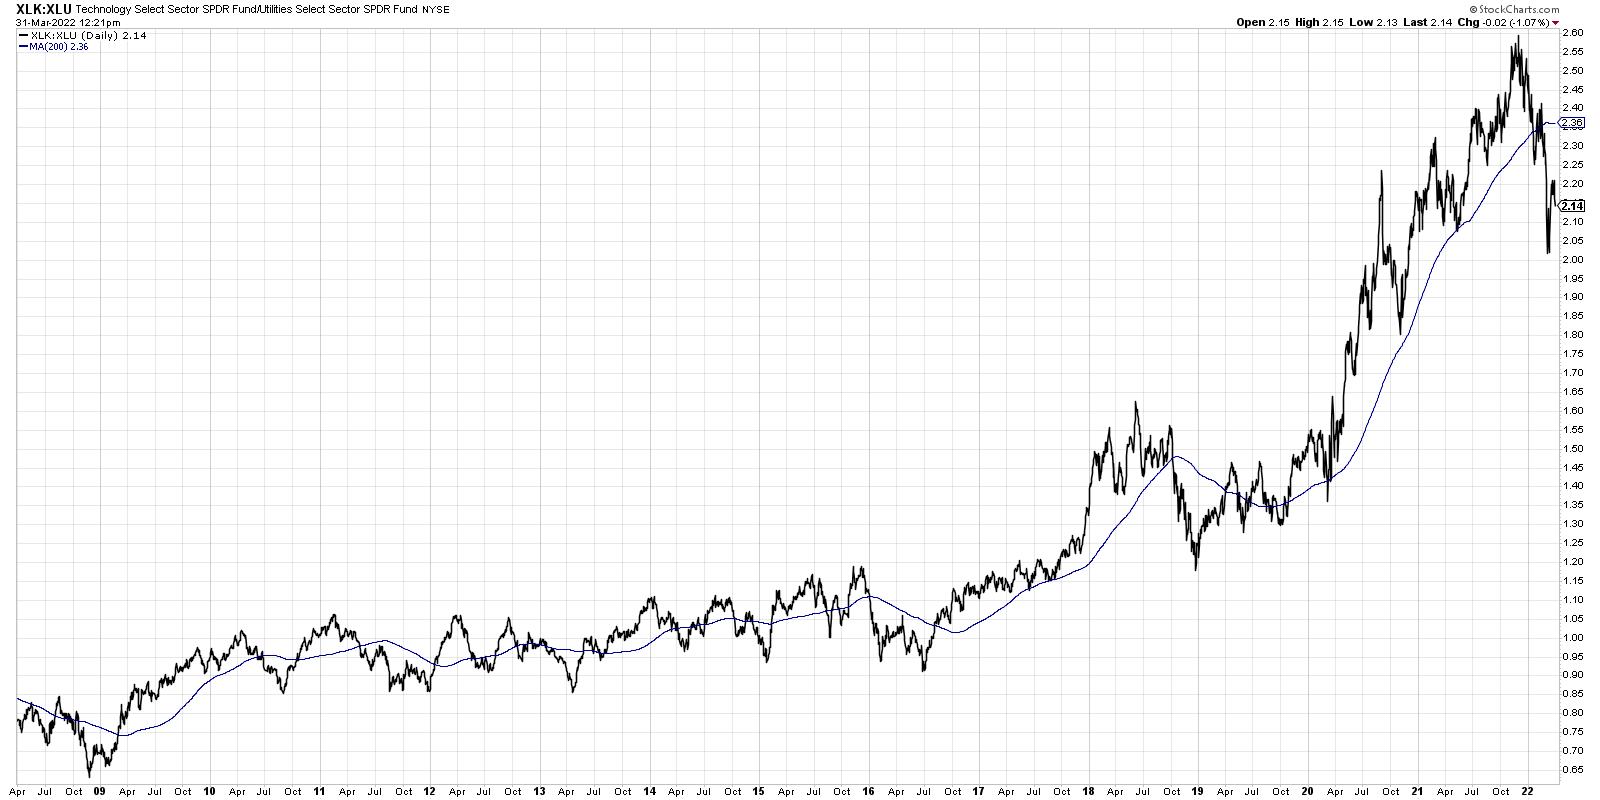
In 2015-2016, 2018 and late 2020, there were stretches of over three months where Utilities outperformed. So why is this such a rare occurrence? Well, for starters, the equity markets tend to appreciate over time. One of the big paper charts in my office shows the US equity markets back to 1921. I can assure you that the long-term trends in stocks in higher. What is more likely to outperform in a rising equity market - companies designed to grow earnings in the coming years, or those relatively low-volatility defensive plays with a healthy income component?
So... is this time different?
Notice the far right end of the above chart, and you'll see how the ratio has taken its steepest downturn since 2009. Let's zoom into the last two years to see that in more detail.
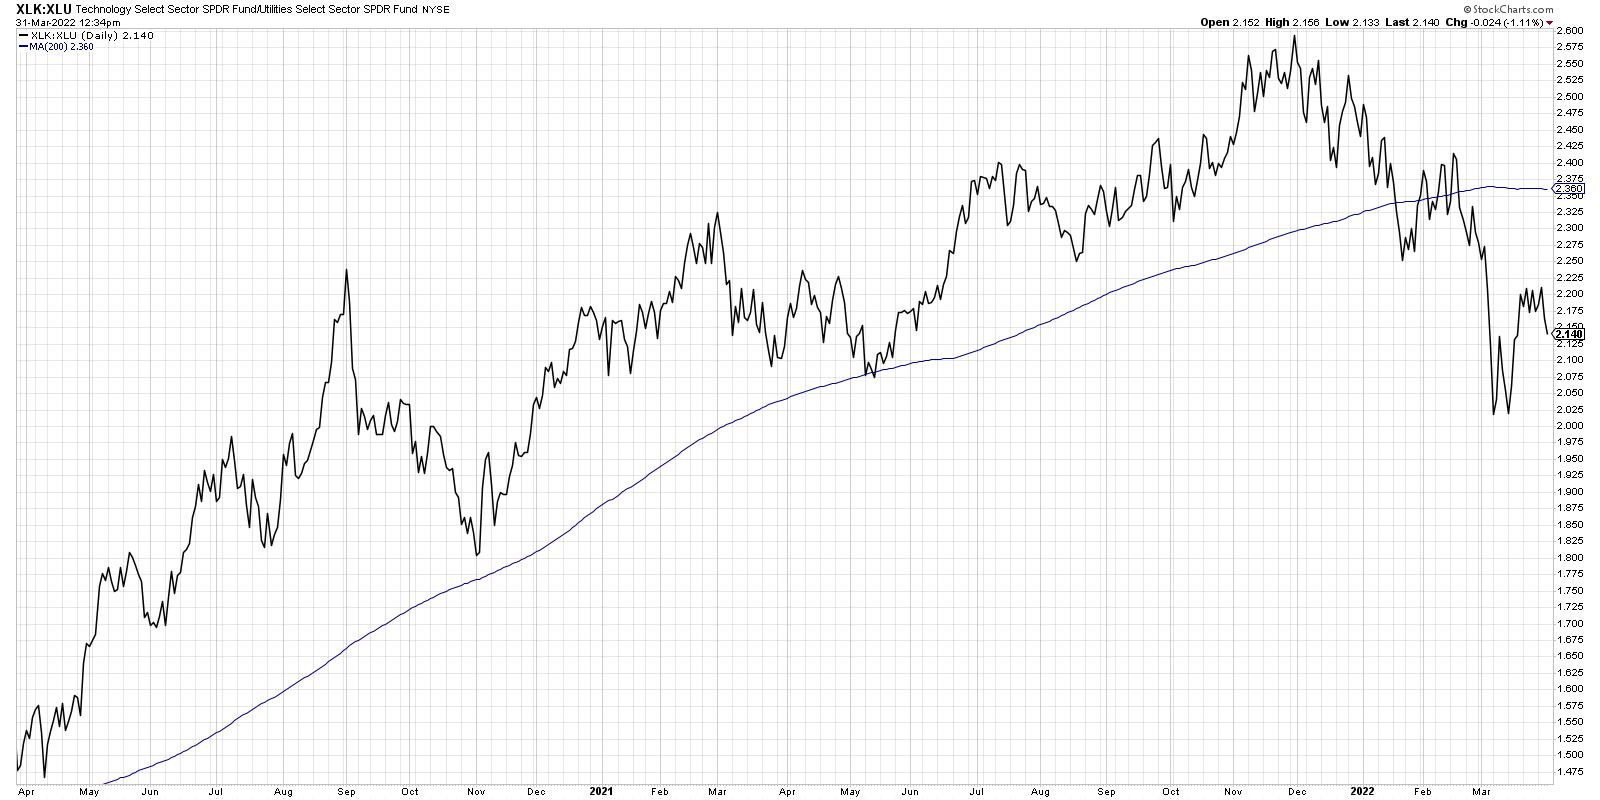
On my closing bell show, The Final Bar, we've been discussing how the equity markets actually topped out in November of last year. While the S&P 500 made a higher high at year-end, the Nasdaq actually topped out in November. On top of that, common measures of market breadth and price momentum all topped out in November as well. So it's not surprising to see that the ratio of Technology vs. Utilities topped out in November as well!
What's next for this ratio, and what does that mean for your portfolio? As interest rates move higher through the course of 2022 and 2023, that should provide a major-league headwind for growth stocks. Does that mean Technology will underperform for the next two years? Not necessarily. But it does make it much more likely that there will be periods where defensive sectors do well, particularly during periods of market uncertainty.
The problem with Utilities here is that, as interest rates rise, the income component embedded in dividend-paying stocks becomes less attractive. If bonds are paying a decent yield, why would you take on the additional risk owning stocks?
At the end of the day, to be honest, none of that really matters. What matters is price. And price is saying that the Utilities sector is breaking to new all-time highs this week, while Technology is still struggling to eclipse its February high. This story is perhaps best told using the Comparative GalleryView feature on StockCharts, where you enter two tickers separated by a comma.
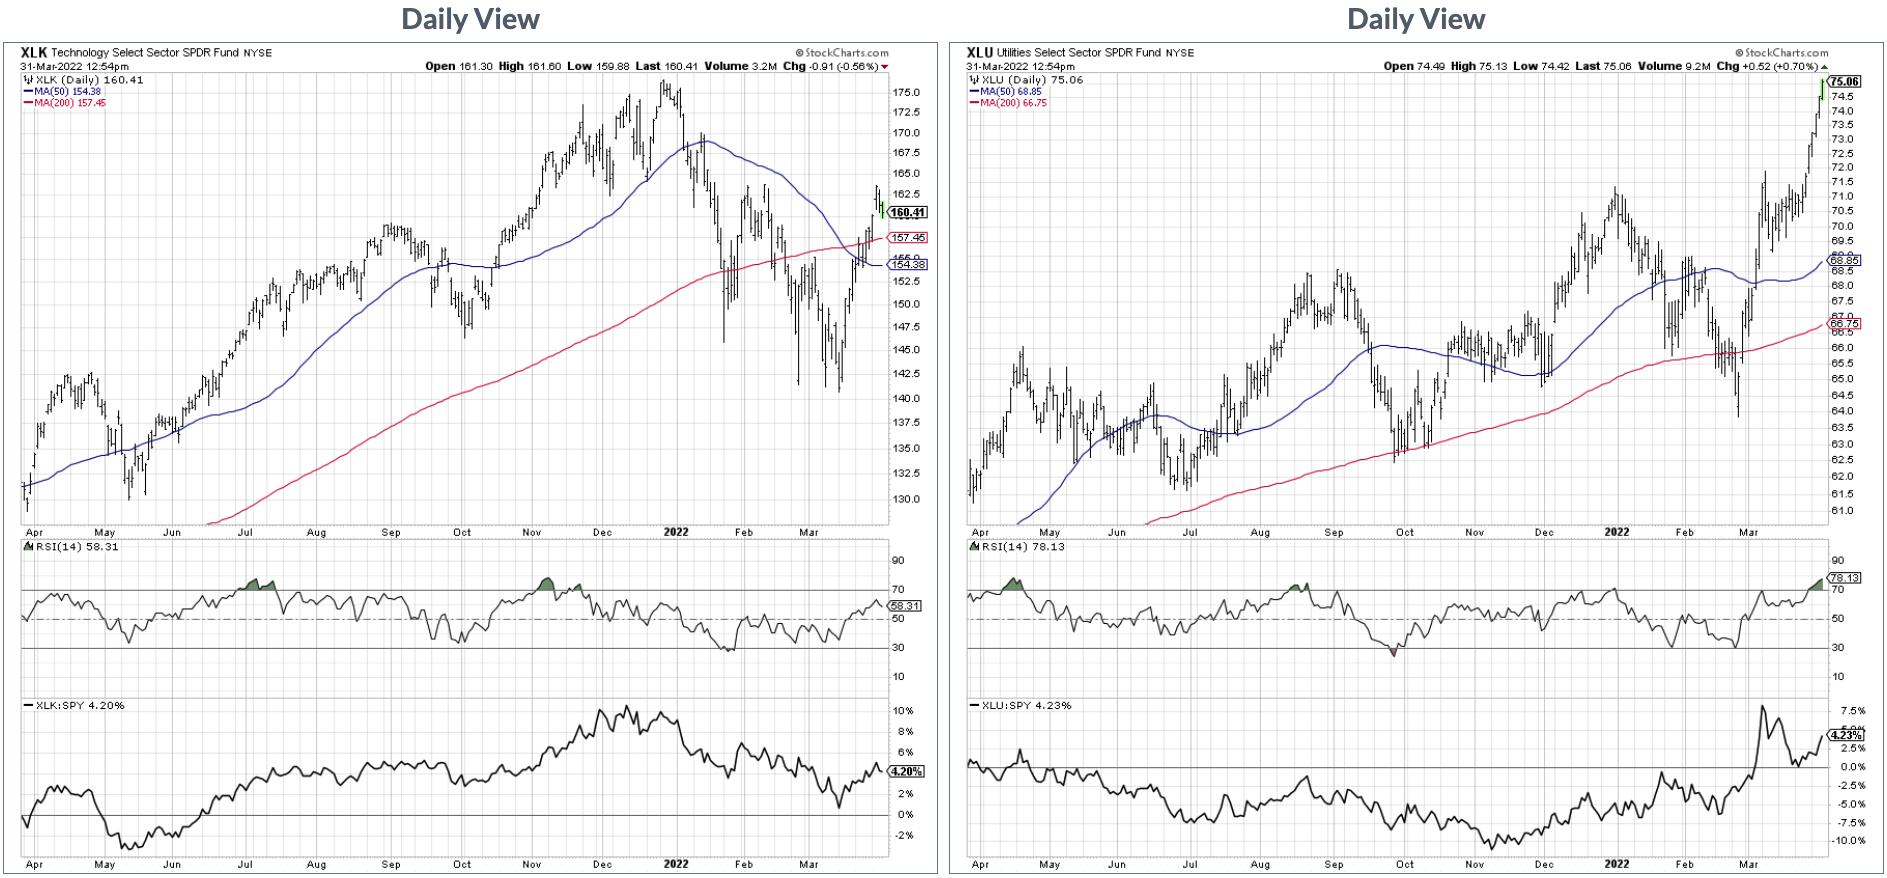
Here, we can see the XLU breaking to new all-time highs this week, as well as the XLK lagging behind in terms of price momentum. When in doubt, follow the price!
Want to learn more about Comparative GalleryView? I just posted a YouTube video including two other hidden features of StockCharts. You can find it over at my YouTube channel!
RR#6,
Dave
David Keller, CMT
Chief Market Strategist
StockCharts.com
Disclaimer: This blog is for educational purposes only and should not be construed as financial advice. The ideas and strategies should never be used without first assessing your own personal and financial situation, or without consulting a financial professional.
The author does not have a position in mentioned securities at the time of publication. Any opinions expressed herein are solely those of the author, and do not in any way represent the views or opinions of any other person or entity.


