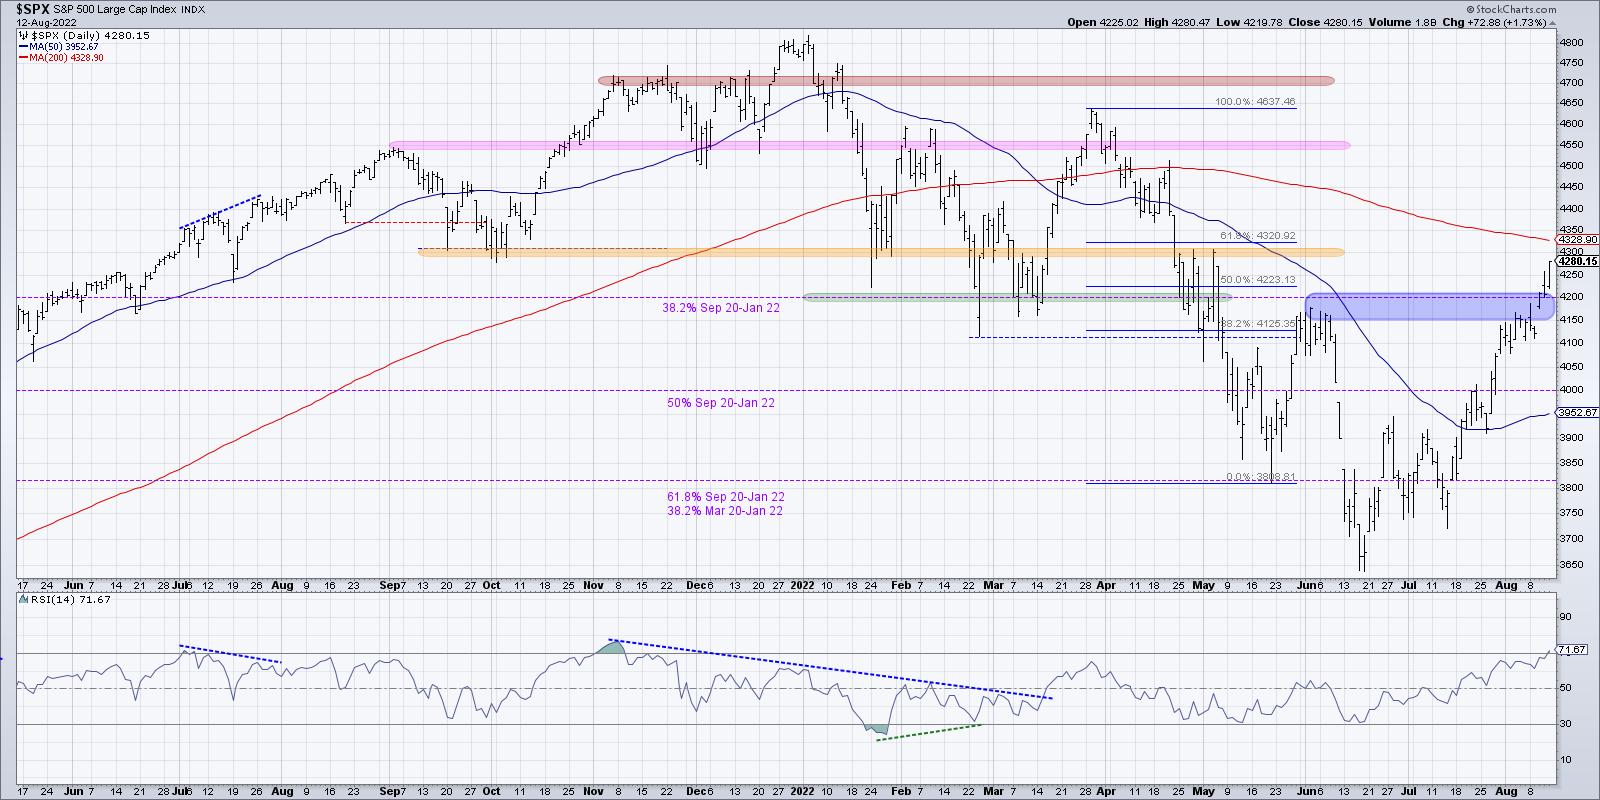
Since the initial rally off the June low, we've been reinforcing the importance of upside resistance in the 4150-4200 range. This is based on an initial Fibonacci retracement off the lows, and also happens to be the peak from early June.
On Wednesday, we finally closed above this level for the first time in two months. Thursday saw an initial follow-through which eventually closed at the lows of the day. Friday's session finally indicated a valid follow-through move after the initial upside breakout.
Now, does that mean we are now in a raging bull market with unlimited upside? Absolutely not.
I see plenty of warning signs, three of which I'll list out below. But the fact that the S&P broke above resistance, before then demonstrating even further buying power with a close around 4280, tells me to respect the trend. And given these breakouts and my Market Trend Model turning bullish last week, I would say the medium-term trend is now bullish.
What are the new upside objectives now that 4200 is in the rear-view mirror? Well, in the short-term, we still need to eclipse the 200-day moving average, which actually lines up with the 61.8% retracement level around 4320. The Russell 2000 ETF actually closed this week above its own 200-day moving average. After that, all eyes would be focused on the February/March highs around 4600. So, if we've confirmed the trend is now positive, then what's the downside risk?
What's next for the S&P 500? In this choose-your-own-adventure style discussion, we describe four potential future paths for the S&P 500 index. The $SPX is up about 15% off the June low and is now testing the 4200 level. Which of these scenarios do you feel is most likely, and why? Let us know in the comments!
First, we've talked about technology shares and other growth names becoming overbought after the acceleration higher off the March lows. Now the S&P 500 itself is overbought, for the first time since November 2021. However, while the overbought condition is in some ways a bullish indication, because stocks and ETFs usually only become overbought in bullish phases, it also tends to be negative in the short-term as it suggests that price has gone too high too quickly.
Second, breadth has gone from incredibly weak to incredibly in a very short period of time. And, in a way, that tells me the market has to pause to relieve that excess positive breadth. For example, in mid-June less than 5% of the S&P 500 members were above their 50-day moving average. The reading on Friday's close? Over 90%.
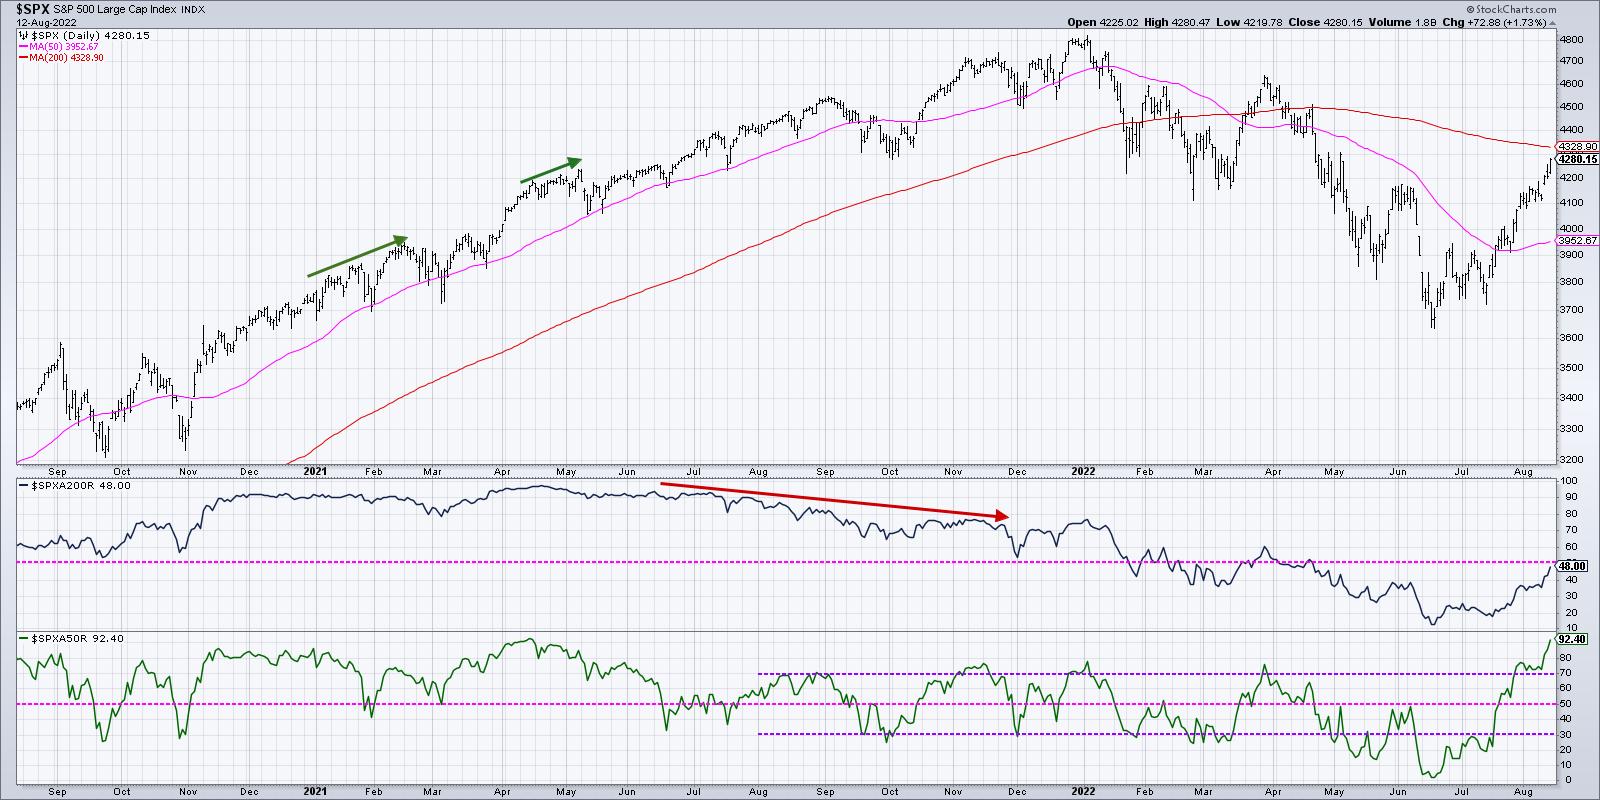
That's right. Almost the entire 500 members of the S&P 500 index rotated back above their 50-day moving average over the last eight weeks. And that's the highest reading in the indicator since April 2021.
This is not a shallow, narrow-led rally. This is a broad-based price expansion, leaving resistance levels destroyed and receding into the background. But when that many stocks make that sort of rotation, my "brief and buyable pullbacks" alarm starts to pop. It's reasonable to expect a short-term pullback to reset the bull market phase and allow a new set of buyers the opportunity to enter the game.
Finally, interest rates have come down a lot already. The Ten-Year Treasury Yield peaked around 3.50% in June and finished this week down at 2.85%. I had two very interesting conversations on interest rates on this week's The Final Bar shows.
Mark Newton, CMT from FundStrat Global Advisors suggested that rates could move higher, and that a higher Ten-Year Yield would be a challenging environment for current leadership sectors like Technology. On the other hand, Ari Wald, CMT of Oppenheimer, argued that we've already seen a peak in rates for 2022, and that lower rates mean plenty of upside for growth stocks.
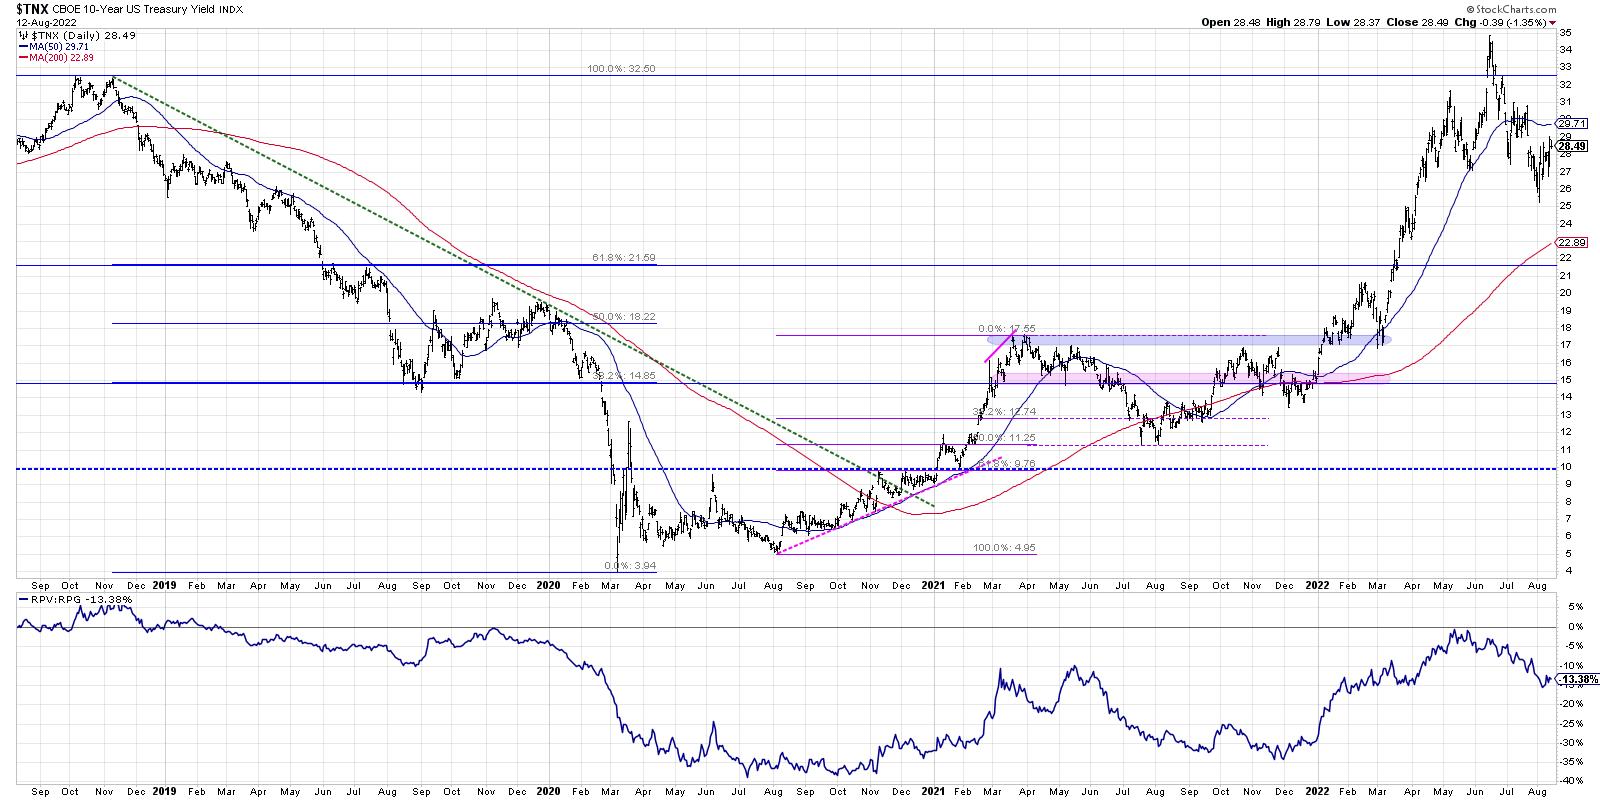
One thing on which we all agreed was that the direction of the Ten Year has been a key macro theme in 2022, with obvious implications on leadership from value or growth names. So, while the bull run for stocks has been impressive to observe, every ounce of my being as a technical analyst tells me to expect a pullback from current levels. I have learned to respect the trend, and I will acknowledge that the trend is decidedly positive based on the last two months. But the short-term readings suggest a market absolutely ripe for a drawdown.
Here's the real problem. What happens when the last bear finally throws in the towel?
RR#6,
Dave
P.S. Ready to upgrade your investment process? Check out my YouTube channel!
David Keller, CMT
Chief Market Strategist
StockCharts.com
Disclaimer: This blog is for educational purposes only and should not be construed as financial advice. The ideas and strategies should never be used without first assessing your own personal and financial situation, or without consulting a financial professional.
The author does not have a position in mentioned securities at the time of publication. Any opinions expressed herein are solely those of the author, and do not in any way represent the views or opinions of any other person or entity.


