While the VIX is often termed the "fear gauge" because of its inverse relationship to stocks, it's really more of a measure of volatility -- implied volatility, that is, which means it's looking at the S&P 500 options market, which then "implies" a volatility for the S&P 500 index.
I tend to describe the VIX as being in a particular "volatility regime." Let's review what we've learned about volatility in 2022.
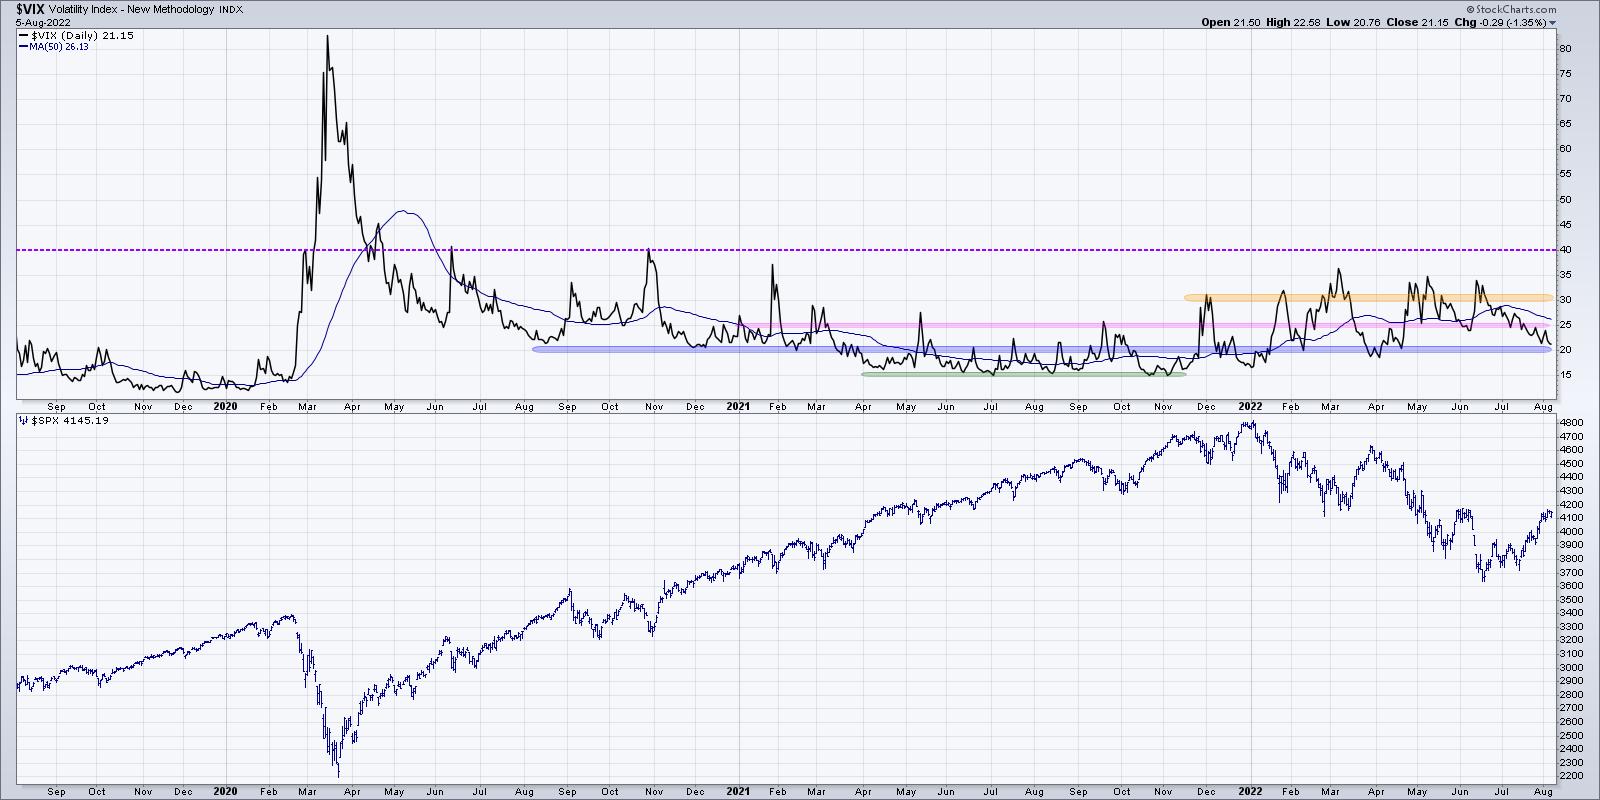
I see this chart in basically five phases. The first phase, through early 2020, was a relatively low volatility environment where the VIX moved between 10 and 20. Then we have the spike during the March 2020 drop, where the VIX reached up above 80. The third phase is the second half of 2020, where the VIX fluctuated between 20 and 40. During the summer of 2021, we entered a fourth phase featuring a low VIX between 15 and 25.
Since November 2021, we've been in a fifth phase, with the VIX ranging between 20 and 30-35. Note how the short-term market bottoms in November 2021, January 2022, March 2022, May 2022 and June 2022 all saw the VIX push just above 30. The market tops in January 2022 and March 2022 both saw the VIX drop below 20. Note the one outlier, which was the June short-term peak, where the VX only reached down to 25.
This chart summarizes the "bear market rally is now over" thesis. This current volatility regime has seen generally elevated volatility, but also a clearly defined range. The VIX is now at the lower end of that range, which is right where volatility was sitting when we reached the March and January market peaks. What would negate this bearish categorization, and support more of a bullish case in the coming weeks?
Quite simply, the VIX would need to get low, and stay low. By remaining at or below 20, the market would be signaling a "change of character," where the market would remain relatively low volume as the S&P 500 eclipses 4200.
Along with our comments last week on breadth indicators indicating a potential market top, this outlines some key components of our thesis that the bear market rally is at the exhaustion point.
What would convince us otherwise? A break above S&P 4200 with strong breadth and low volatility would cause us to sharpen our pencils and outline some upside targets for stocks!
Want to digest this article in video format? Check it out on our YouTube channel.
RR#6,
Dave
P.S. Ready to upgrade your investment process? Check out my YouTube channel!
David Keller, CMT
Chief Market Strategist
StockCharts.com
Disclaimer: This blog is for educational purposes only and should not be construed as financial advice. The ideas and strategies should never be used without first assessing your own personal and financial situation, or without consulting a financial professional.
The author does not have a position in mentioned securities at the time of publication. Any opinions expressed herein are solely those of the author, and do not in any way represent the views or opinions of any other person or entity.


