I have very fond memories of time spent in the Fidelity Chart Room, from discussing the merits of contrary opinion with teams of financial advisors to teaching student investment clubs about the value of technical analysis. But one of my favorite "behind the scenes" moments came in 2009.
You see, much of the Fidelity Chart Room consists of wall-sized paper charts telling the history of the financial markets through the language of technical analysis. (Yes, I have such positive memories of time spent with paper charts that I basically turned my home office into a miniature Chart Room!) Back in 2009, the S&P 500 had broken back below 1,000 as investors grappled with the realities of the financial crisis. Stocks were breaking support and the charts went from bad to worse seemingly every day. The downturn was so severe, in fact, that some of the paper charts in the room had to be reprinted because the price had gone below the lower end of the printed price scale.
That's right, the market literally went off the bottom edge of the paper. Our Chart Room team had to reprint entire walls of the room to adjust the scales to accommodate the most recent bearish price action. Talk about a fantastic piece of anecdotal evidence, when the Chart Room has to be rescaled due to bearish price action.
Soon after, the 2009 low was in place and the market began to rally. But I never forgot the lesson that extreme price movements to the downside, despite how painful they can be during the moment, have always returned back to new highs. Sometimes it has taken longer than other times, but, 100% of the time the market has indeed recovered.
ChartCon 2022 is happening in less than two weeks! This week, I spoke with Marc Chaikin about his expectations between now and year-end 2022 for equities. I also chatted with Joe Rabil, Julius de Kempenaer and Bruce Fraser about their "Sector Deep Dive" presentations. We have so many ideas and perspectives to share with you, and you don't want to miss this rare opportunity to learn from some of the top names in technical analysis! Sign up today.
So when I see the AAII Survey get incredibly bearish, with over 60% of respondents saying they are bearish on the US stock market, I have to acknowledge two things; 1) the market is most likely going lower for now, and 2) the market is eventually going to make new all-time highs again.
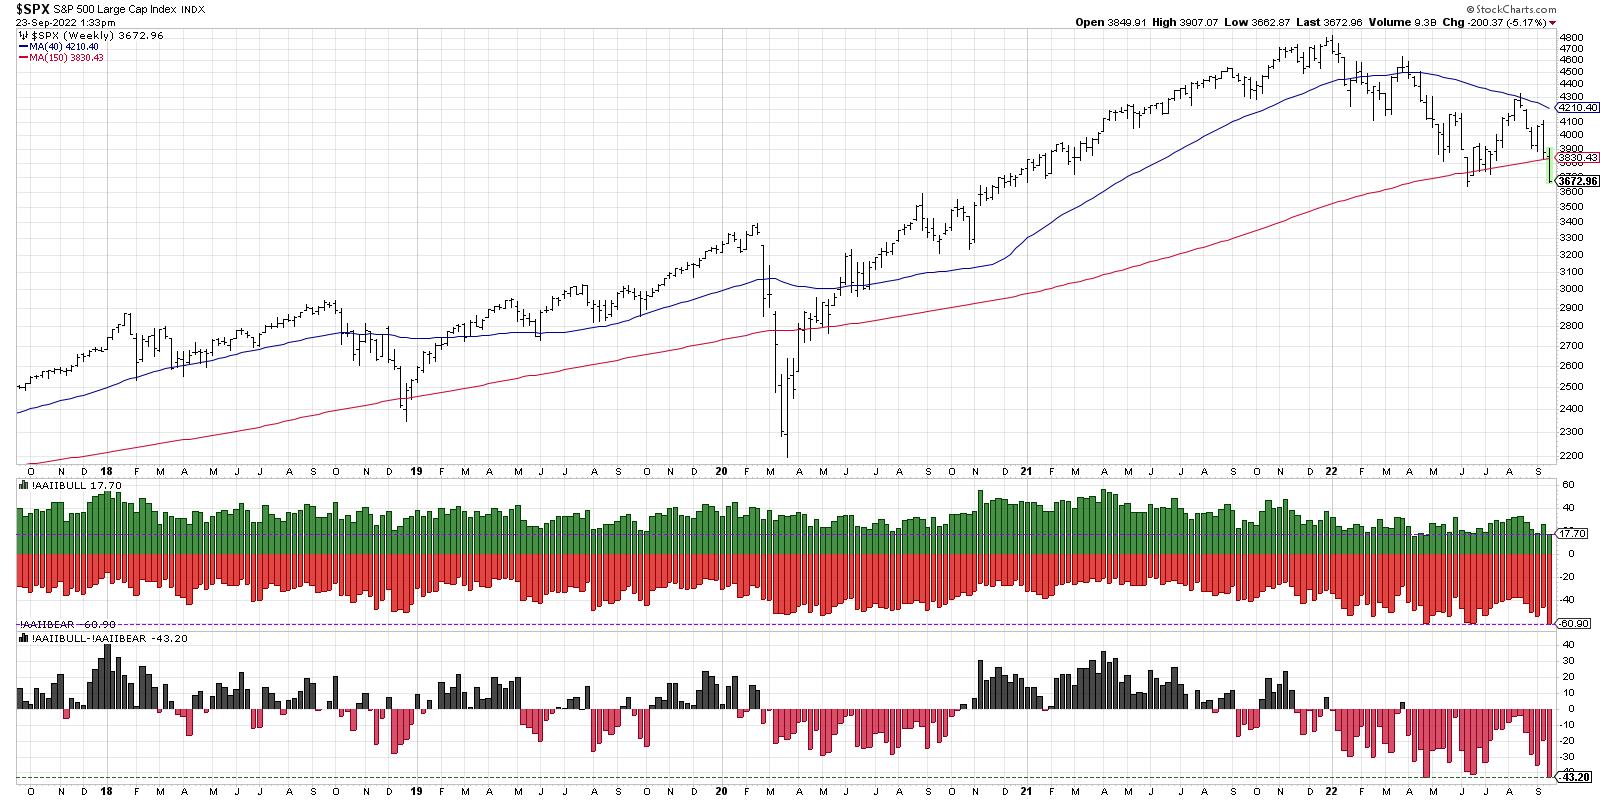
The AAII bearish reading has reached 60% two times already in 2022, in April and June. While the bearish reading in June lined up well with the June market low, it's worth noting that the April 60% reading occurred in the midst of a downturn. So just because the indicator hits 60% does not guarantee an imminent bottom.
We can also look at the spread between bulls and bears (bottom panel), which shows bears outnumbering bulls by about 43%. While this is the lowest reading for the last five years, we have to remember that indicators like this can and do get much lower.
Let's bring in more data and see what we can learn.
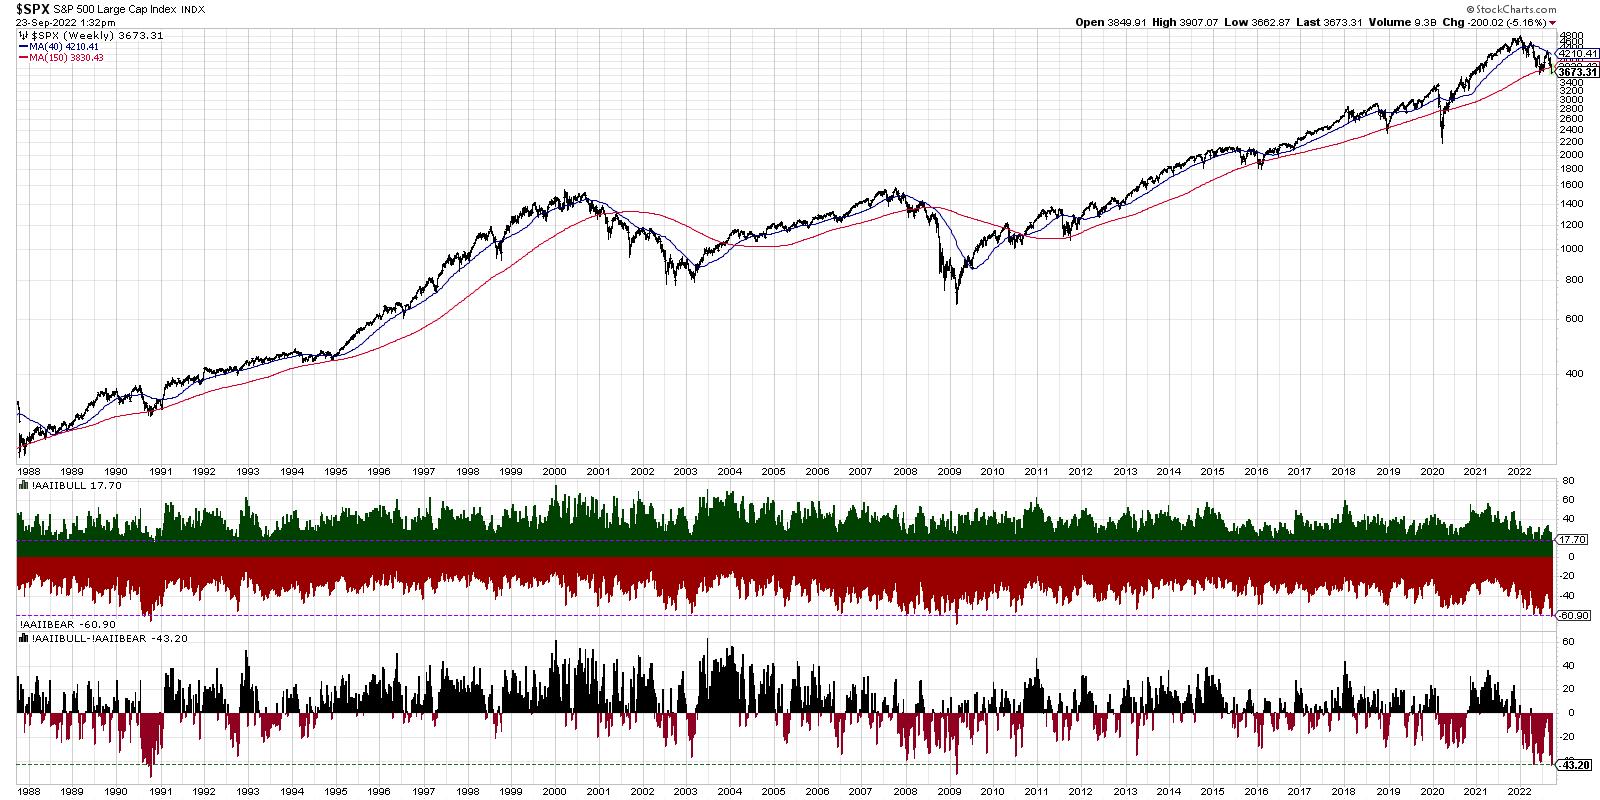
How often have we seen over 60% bears in the AAII survey, along with a spread of over 40% between bears and bulls? Going all the way back to the 1987 market crash, this has only happened two other times: in 2009 and 1990.
In 2008-2009, you'll see that the AAII bearish reading first reached 60% in early 2008. The indicator showed consistent readings around that level for another year before the ultimate bottom in 2009.
In 1990, it was less than four months between the first 60% bearish reading and the ultimate bottom in prices. Note that, in 1990, the S&P 500 stopped right at the 150-week moving average before moving higher. In 2008, the bounce off the 150-week moving average was the first step of multiple painful steps lower.
In both 2009 and 1990, the spread between bears over bulls eventually reached over 50% at the market bottom. So, based on that simple analysis, we may not be at the market bottom just yet.
So the good news is we've seen AAII readings lean even more bearish than current levels. The bad news is the most recent example of this pattern, 2008-2009, saw the market move materially lower after the initial bearish signs were registered.
My conclusion: this downturn may be just the beginning.
RR#6,
Dave
P.S. Ready to upgrade your investment process? Check out my YouTube channel!
David Keller, CMT
Chief Market Strategist
StockCharts.com
Disclaimer: This blog is for educational purposes only and should not be construed as financial advice. The ideas and strategies should never be used without first assessing your own personal and financial situation, or without consulting a financial professional.
The author does not have a position in mentioned securities at the time of publication. Any opinions expressed herein are solely those of the author, and do not in any way represent the views or opinions of any other person or entity.


