While the technical analysis toolkit has certainly evolved over time, having benefitted from advances in computing and data analysis, in many ways, the tools of the modern technical analyst are not far from the original work of Charles Dow in the early 20th century. But an updated version of his classic "Dow Theory" suggests that the markets have entered a new bullish phase, as both the S&P 500 and Nasdaq are making new swing highs.
Dow's Foundational Analysis of Markets
To be clear, Dow's work was all done via paper and pencil, a practice which continued well into the 1980s for many technical analysts (or "chartists" as Ralph Acampora enjoyed telling me they were called, given that much of their time was spent creating charts instead of analyzing them!).
One of Charles Dow's contributions was so significant that now we simply call it "Dow Theory". He proposed looking at two indexes, the Dow Industrials and the Dow Railroads (now evolved into the Dow Transports), and seeing if they were in agreement. If both indexes were breaking to new highs, the market was strong. If both indexes were breaking to new lows, the market was weak. If there was a non-confirmation, where one of the indexes was breaking out but the other wasn't, then it indicated a potential reversal point. His theory was based on the importance of these two groups—the Industrials as the producers of goods and the Railroads as the distributors of goods—as a way to evaluate the strength of the economy.
Dow Theory for the Modern Age
Now, in 2023, the Dow Industrials includes a fairly diverse group of businesses that are better classified as service-oriented than product-oriented. And the Dow Transports includes stocks like JetBlue (JBLU) and Avis Budget Group (CAR). Not really the distributors of goods. Plus, perhaps most importantly, names like Target (TGT) and Amazon (AMZN), arguably to be included in both indexes, are actually in neither of them!
So I now prefer to use a New Dow Theory, comparing the S&P 500 index (representing the old economy) and the Nasdaq Composite (the new economy). If both indexes are in uptrends, the market is strong.
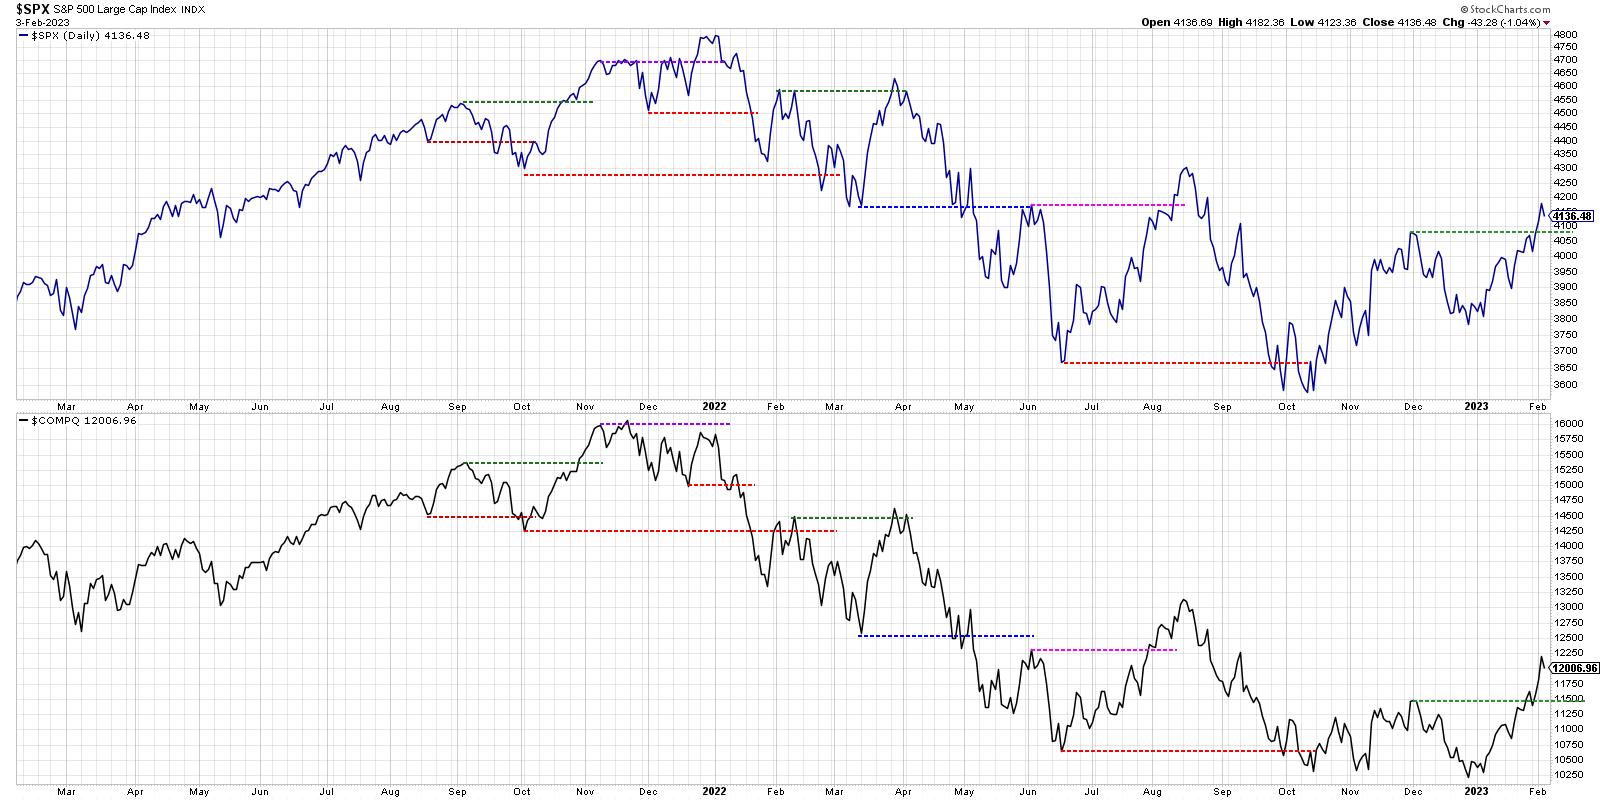
What's most striking to me about this chart is the bearish non-confirmation that occurred at the end of 2021. Notice how the S&P 500 was making a new all-time high while the Nasdaq Composite was making a lower high?
This pattern suggested that the breakout for the S&P 500 was suspect and to be faded, not bought. To be honest, this was one of many divergences you'll find during this period, along with weakening momentum, weakening breadth, and a lower high for small caps.
New Dow Theory in February 2023
Both the S&P 500 and the Nasdaq Composite made a new 52-week low in October of last year, providing a bearish confirmation. Then, in December, the Nasdaq continued to make lower lows while the S&P 500 bounced higher to achieve a higher low before year-end. This was a bullish non-confirmation, where one index makes a new low but the other one does not confirm the bearish setup. It suggests the bear market phase of 2022 was at a potential inflection point.
Here in February 2023, you'll note how both indexes made a new swing high as they pushed above their December 2022 peaks. This is what I'd consider a bullish confirmation, where both the old economy and new economy indices are confirmed in a new uptrend.
Both the S&P 500 and Nasdaq are facing significant overhead resistance. Until we see the S&P 500 push above its August 2022 high around 4300, and the Nasdaq break above its own August 2022 high around 13,000, then the upside potential for stocks may be limited beyond current levels.
"Don't fight the tape." That's what I was told early on in my career. And the New Dow Theory suggests that the tape is telling us that it's onward and ever upward for stocks. Combined with renewed strength in breadth indicators like the McClellan Oscillator, we have a strong start to 2023 for the S&P 500!
RR#6,
Dave
P.S. Ready to upgrade your investment process? Check out my free behavioral investing course!
David Keller, CMT
Chief Market Strategist
StockCharts.com
Disclaimer: This blog is for educational purposes only and should not be construed as financial advice. The ideas and strategies should never be used without first assessing your own personal and financial situation, or without consulting a financial professional.
The author does not have a position in mentioned securities at the time of publication. Any opinions expressed herein are solely those of the author and do not in any way represent the views or opinions of any other person or entity.


