I've recognized the strength displayed by the S&P 500 and Nasdaq Composite off the October lows. I've written about the New Dow Theory buy signal and the improvement in breadth indicators like the percent of stocks above moving averages. So, while I am not as all-in uber-bullish as my friend Tom Bowley, I certainly will admit that the strength we have seen thus far in 2023 usually leads to further strength down the road.
Three charts I'm watching suggest that we may be in short-term pullback mode, with a non-zero probability that it leads to a retest of the December lows. Will this represent a better entry point for investors that have missed all the bullishness of the last six weeks?
Bullish Percent Index Becomes Less Bullish
First, let's review a breadth indicator driven entirely by point & figure charts.
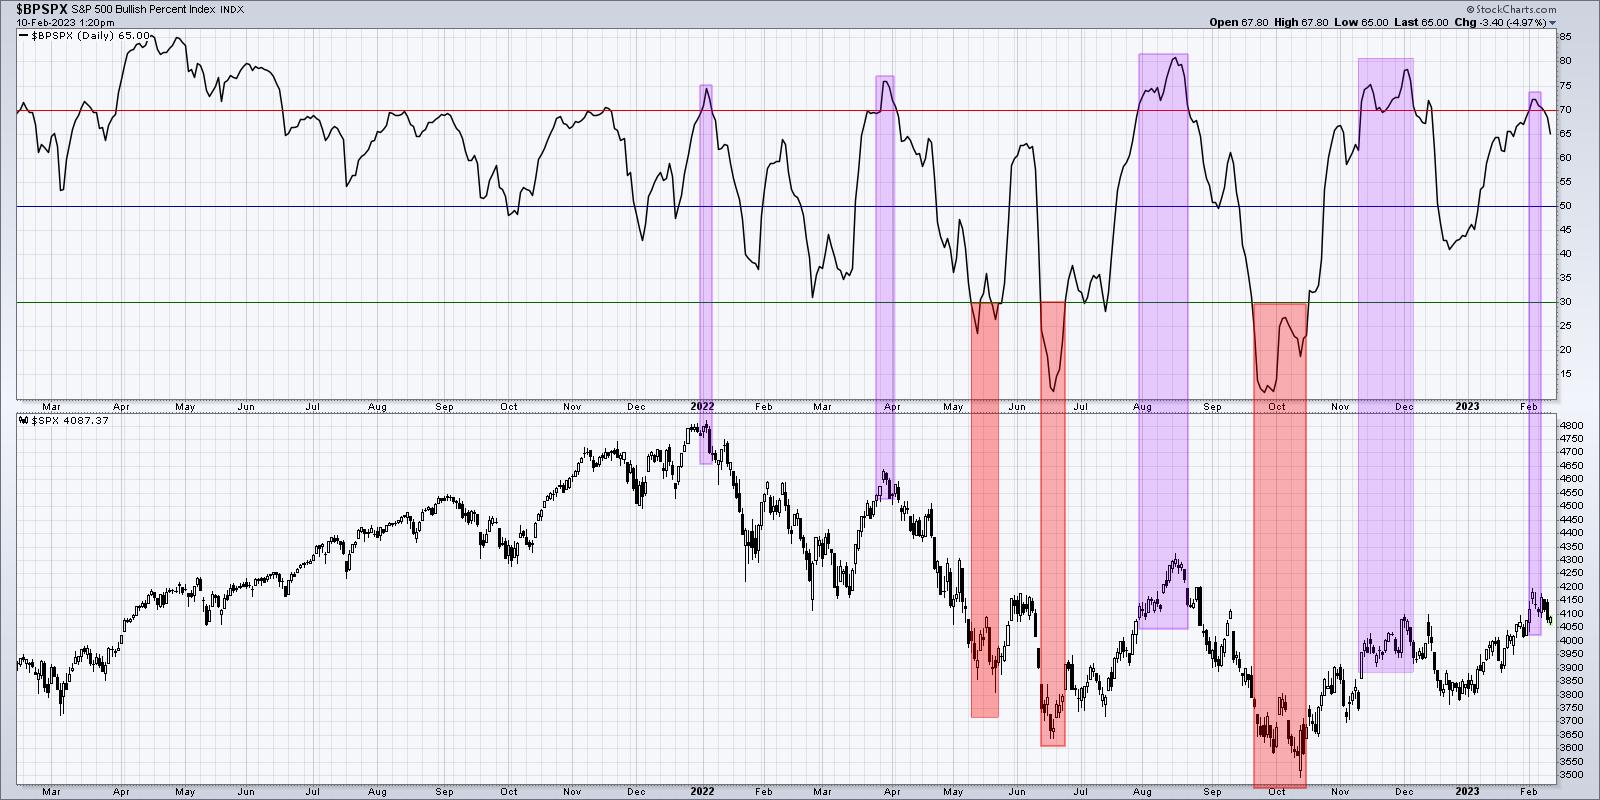
The Bullish Percent Index was one of the most helpful indicators to navigate 2022. Most of the major tops last year saw this indicator move above 70 toward the end of the upswing, then right back below 70 to indicate a downside reversal. We also had three buy signals, where the indicator dipped below 30 and then back higher. Two of those times beautifully indicated the June and October lows.
At the end of January, the Bullish Percent Index pushed above the key 70 level, suggesting the latter stages of a bull move. This week, we have noted this indicator has moved back below the 70 level, which suggests a new leg down for the S&P 500.
McClellan Oscillator No Longer Bullish
I shared a video last week about the McClellan Oscillator, a well-designed adaptation of advance-decline data.
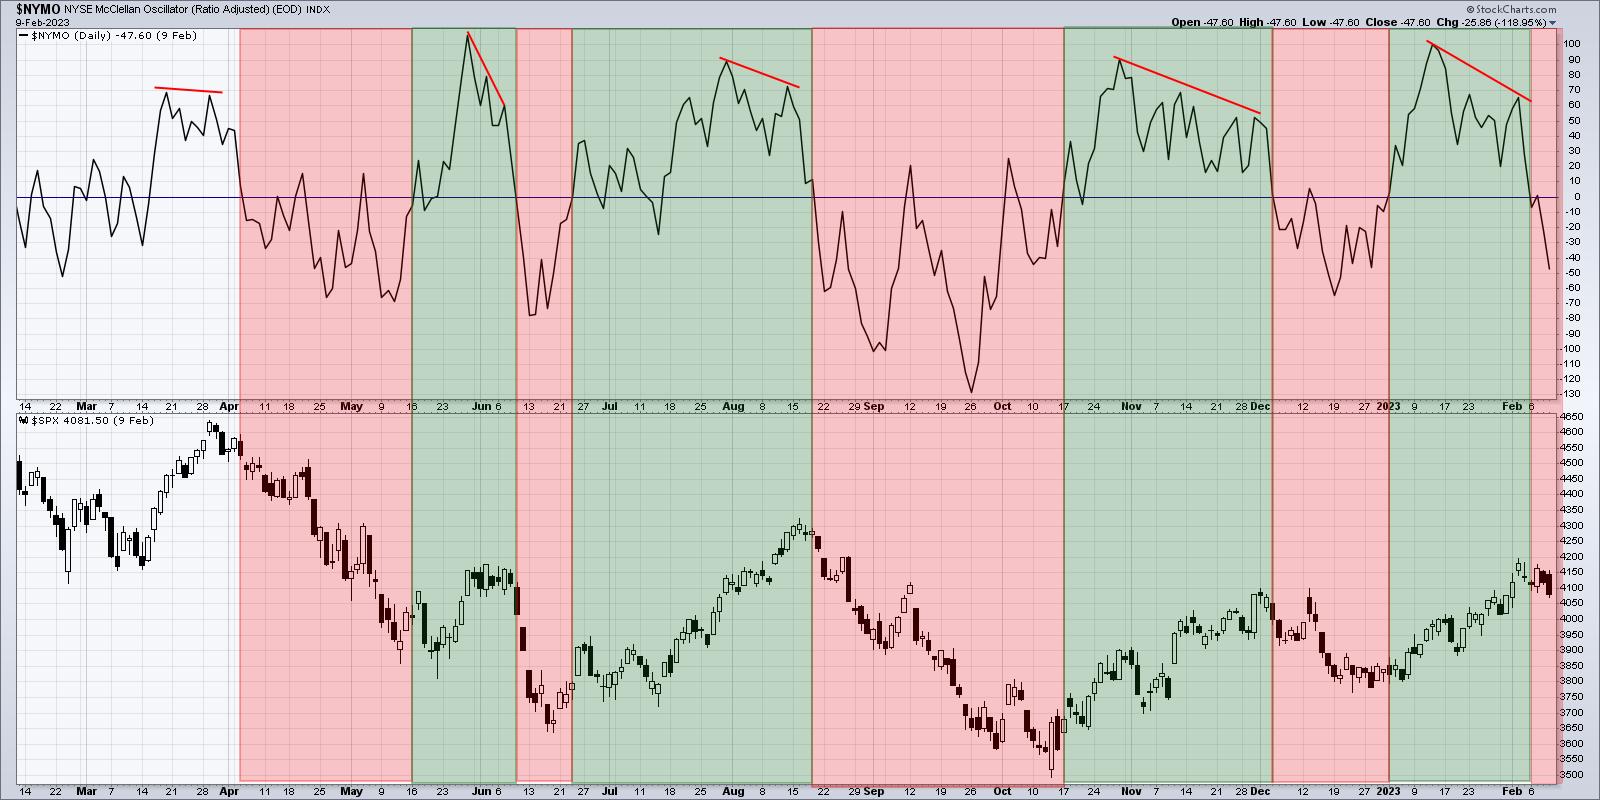
Simply put, the market is bullish when the McClellan Oscillator is above zero, and bearish when it is below zero. There's certainly more to the indicator, including the bearish divergences indicated with red lines on my chart.
But if you look at what the S&P 500 has done when the indicator is above zero vs. below zero, you can see why this breakdown is an important gauge of market breadth and should give bulls some pause about next couple weeks.
A Foreboding Increase in Volatility
Finally, we can look at volatility, which has remained fairly low since December of last year.
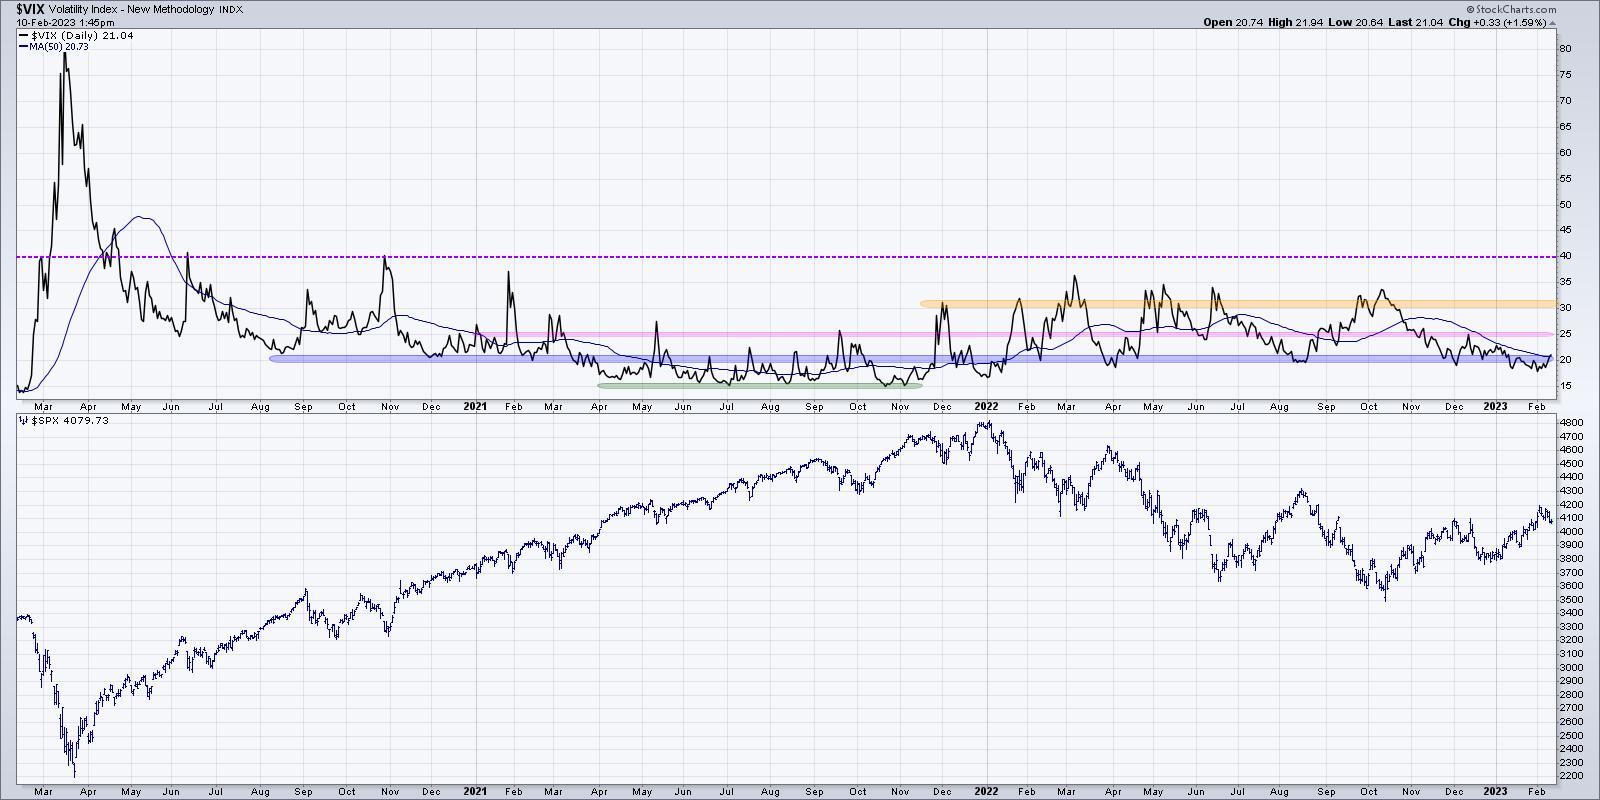
I had a great conversation with Katie Stockton recently about the prospects for the market to rally on lower volatility, which is something we really hadn't seen since the October low. Well, this week, the VIX pushed back above the 20 level, which may be the beginning of a return to a higher volatility regime.
Why is high volatility a concern? Well, the market doesn't tend to rally on high volatility. The reason is that, when investors get nervous and panic, they tend to sell quickly and anxiously. This pushes the VIX, or the "fear gauge", higher to reflect investor uncertainty.
Markets tend to have sustained advances on lower volatility because investors tend to accumulate shares over time during a bull market phase. We don't anxiously accumulate shares (although that can happen in the "irrational exuberance" phase at the end of bull markets!), so a market uptrend with a relatively low VIX would be pretty bullish. As the VIX has moved back above 20, we're faced with weakening price characteristics as the SPX dips below 4100, declining breadth indicators with similar signals to previous corrective moves, and stocks like GOOG in a freefall.
Bullish on stocks here? The indicators we shared today could mean an even better entry point to ride the next bull move higher. But these indicators will need to improve, as, otherwise, they suggest a more painful downdraft than some may expect.
Want to learn more about how we use RSI to analyze price momentum? Hit my YouTube channel.
RR#6,
Dave
P.S. Ready to upgrade your investment process? Check out my free behavioral investing course!
David Keller, CMT
Chief Market Strategist
StockCharts.com
Disclaimer: This blog is for educational purposes only and should not be construed as financial advice. The ideas and strategies should never be used without first assessing your own personal and financial situation, or without consulting a financial professional.
The author does not have a position in mentioned securities at the time of publication. Any opinions expressed herein are solely those of the author and do not in any way represent the views or opinions of any other person or entity.


